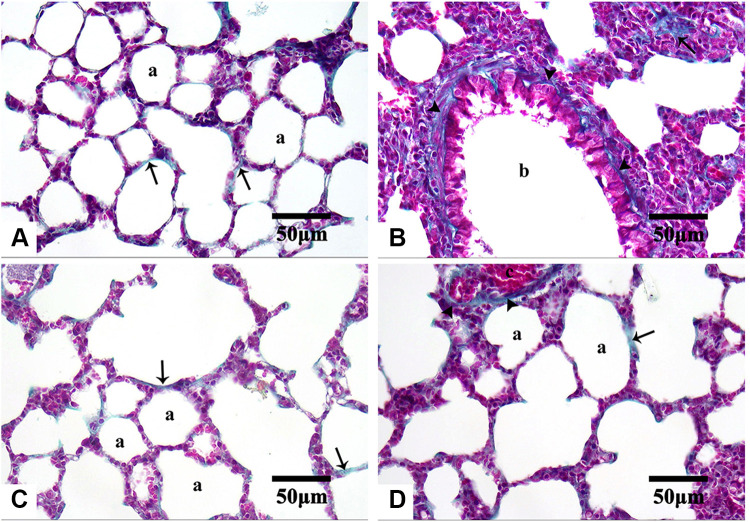
Figure 9.
Microphotographs of Masson’s trichrome stained-lung sections of the control and the treated groups.
Notes: Control (A), Group I (B), Group II (C), and Group III (D). Few collagenous fibers (arrows) are in the alveolar wall (a) of both control and Group II. Noticeable fibrous tissue deposition (arrowheads) looks around bronchioles (b) and in the alveolar wall of Group I. Less amount of fibrous tissue is observed (arrowheads) around congested blood vessels (c) in Group III. Masson’s trichrome, 400×.

