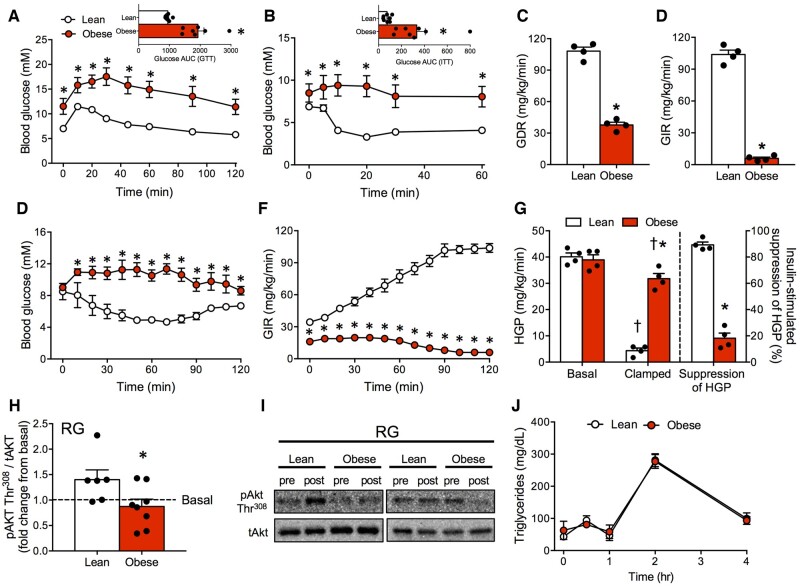
Figure 2.
Glucose Intolerance and Insulin Resistance in Spontaneous Obese Mice. (A, B) Spontaneously obese mice presented with profound glucose and insulin intolerance. (C–F) Hyperinsulinemic–euglycemic clamps revealed dramatically lower GDR and GIR in obese mice. (G) HGP was elevated in spontaneously obese mice, and the ability of insulin to suppress HGP was attenuated. (H, I) RG muscle of obese mice was insulin resistant, indicated by a reduction in AktThr308 phosphorylation following insulin stimulation. (J) Despite insulin resistance, lipid tolerance (triglyceride responses) following lipid ingestion was not altered in obese mice. Data expressed as mean ± SEM of results obtained from n = 4–8 for each genotype. *P < .05 versus lean, †P < .05 versus basal unstimulated (unpaired two-tailed Student’s t-test). AUC, area under curve; GDR, glucose disposal rate; GIR, glucose infusion rate; GTT, glucose tolerance test; ITT, insulin tolerance test.

