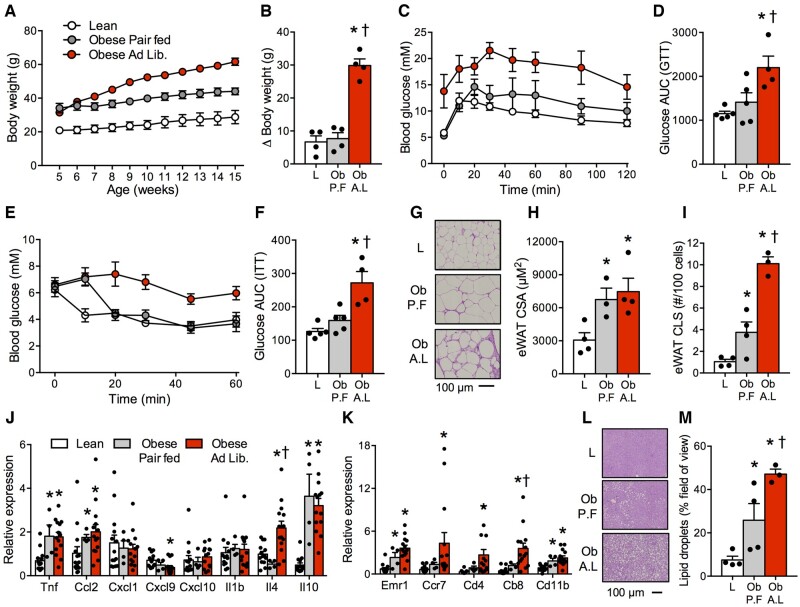
Figure 5.
Food Restriction Attenuates Many of the Phenotypic Characteristics of Obesity. (A, B) Pair feeding obese animals to match caloric intake of lean animals normalized weight gain. (C–F) Pair fed obese mice presented with normal glucose and insulin tolerance. (G–I) Histological images of eWAT revealed that pair feeding did not affect adipocyte CSA, but attenuated CLS. (J) Pair feeding did not affect the mRNA signature associated with inflammatory tone or macrophage/dendritic markers (Emr1, Cd11b) associated with obesity. (K) Food restriction partially improved markers of T-cells, including cytotoxic, helper, and memory T cells (Cd4, Cd8, Ccr7). (L, M) Histological images of the liver demonstrated that pair feeding reduced lipid droplet content. Data expressed as mean ± SEM of results obtained from n = 4–14 per genotype. *P < .05 versus lean, †P < .05 versus obese pair fed (one-way ANOVA with LSD post hoc). AUC, area under curve; A.L., ad libitum obese mice; GTT, glucose tolerance test; ITT, insulin tolerance test; L, lean mice; Ob, obese mice; P.F., pair fed obese mice.

