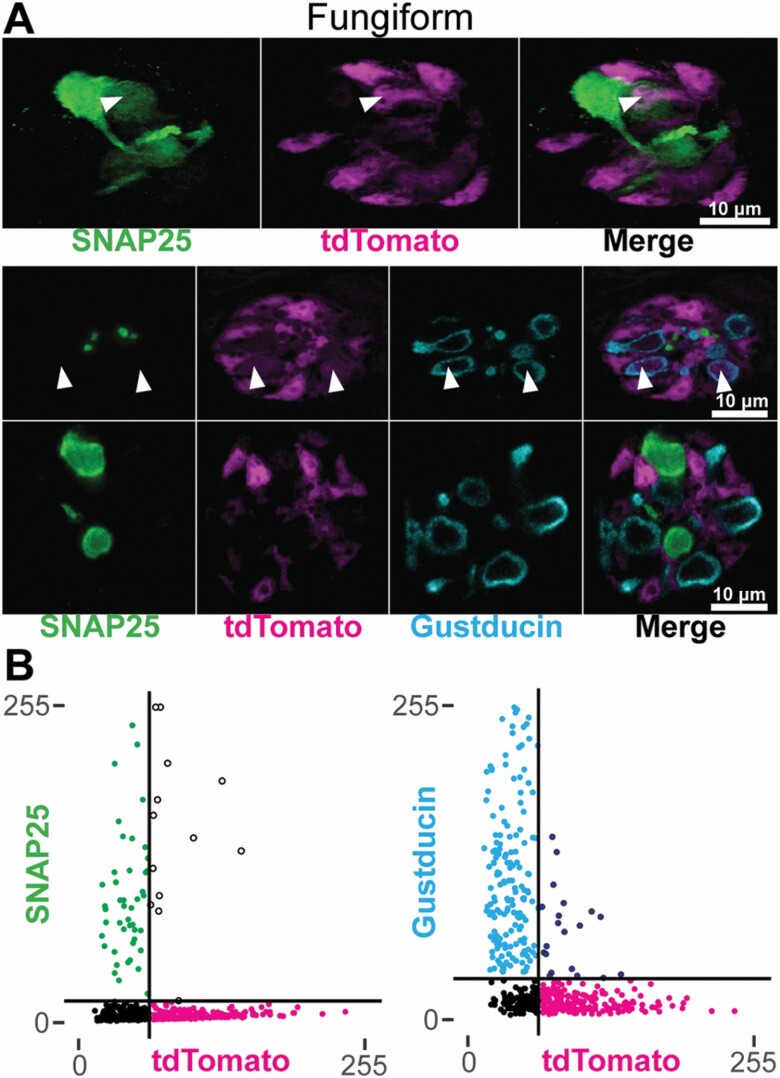
Figure 3.
(A) Confocal images of whole-mount fungiform taste buds from GAD65Cre/tdTomato mice. Fungiform taste buds are imaged in cross-section. Images are single optical planes. Type III cells are identified by SNAP25 immunoreactivity (green) and a subset of Type II cells are identified by Gustducin immunoreactivity (cyan). Arrowheads indicate tdTomato fluorescence in either a Type II or Type III cell. Images were background-subtracted and scaled using the same method for quantification (see Materials and methods). (B) Quantification of cell profile fluorescence intensities. Cell profiles were measured in optical sections to assess the degree of overlapping signals. Horizontal and vertical black lines show the calculated threshold levels of 2 standard deviations above the background. Black points are those below the threshold in both channels. Points in the upper right quadrant are those found above-threshold in both channels.

