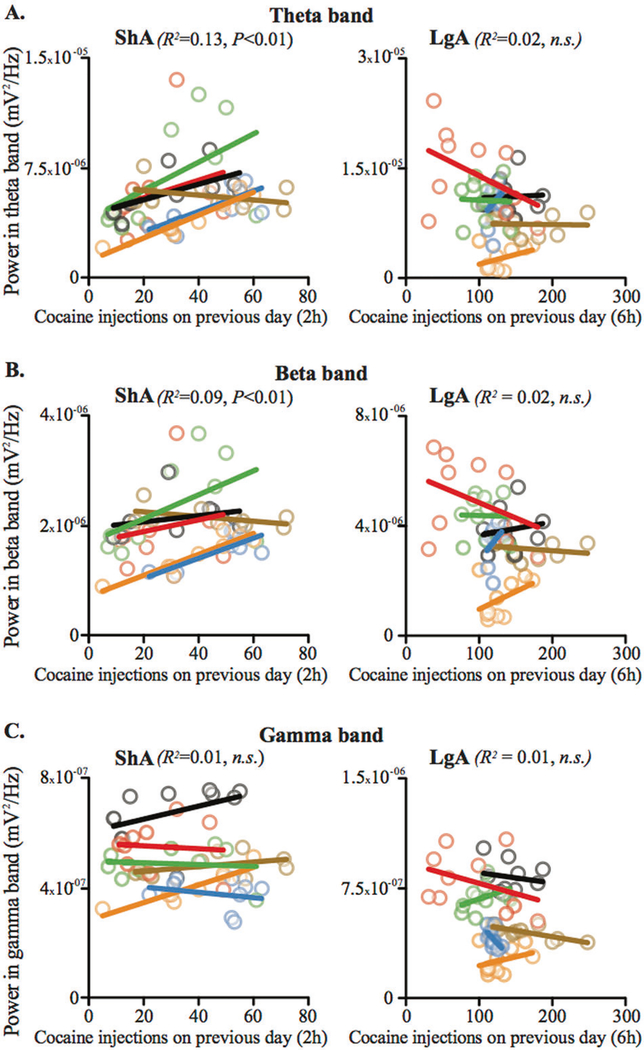
Fig. 2.
During baseline recording, theta and beta oscillations in the STN show a correlation with the number of cocaine injections taken the day before during ShA, but not LgA sessions. Diagrams showing the correlations (bold lines) between STN oscillation power of the theta (a), beta (b), and gamma bands (c) and the amount of cocaine taken on the previous day during the baseline recordings preceding ShA (left panels) and LgA sessions (right panels) for each animal (light shaded-color circles). A significant correlation was found for the theta and beta, but not for the gamma, bands for ShA (a F1,42 = 9.2917, P < 0.01; b F1,42 = 7.55, P < 0.01; c F1,42 = 2.14, n.s.; ANCOVA controlled for inter-individual differences). In contrast, no correlation was found during the baseline sessions preceding LgA sessions (a F1,48 = 2.34, n.s.; b F1,48 = 1.09, n.s.; c F1,48 = 2.78, n.s.)

