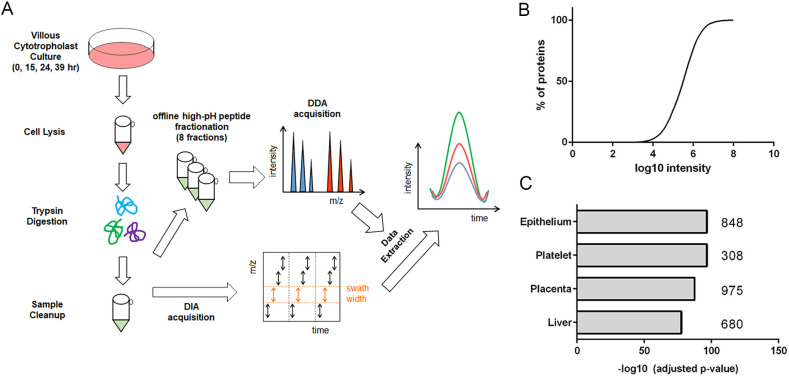
Fig. 1.
Global proteomic profiling of cytotrophoblast differentiation/invasion. (A) Simplified workflow schematic of cytotrophoblast proteomic analysis using SWATH-MS. (B) Distribution of relative protein abundances, spanning four orders of magnitude. (C) Tissue enrichment analysis of annotated proteins from the dataset. n=4 biological replicates.

