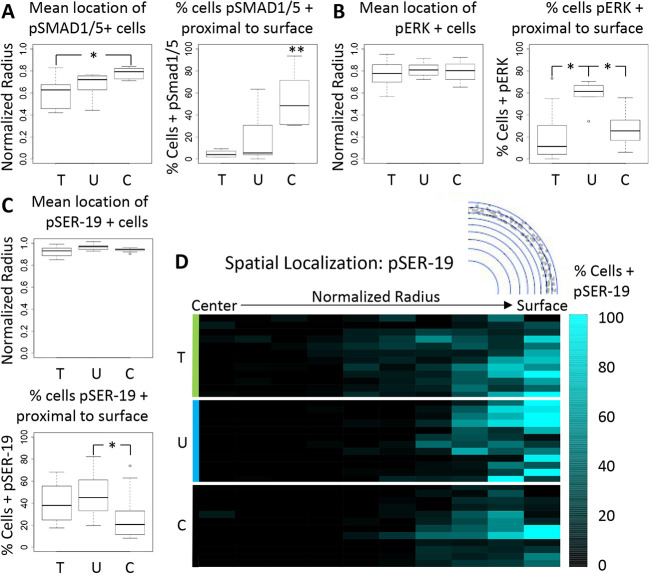
Fig. 6.
Smad1/5, ERK and myosin activity are spatially coordinated in response to osmotic stress. (A) The mean normalized radii for pSmad1- and pSmad5-positive cells in HH25 cushions cultured under osmotic conditions, and percentage of signal at or near the cushion surface. (B,C) The same scenarios are shown for pERK-positive cells (B) and pSER19-positive cells (C). Lines within boxes indicate the median. The length of each box represents the interquartile range. The whiskers indicate the highest and lowest observed values (unless outliers, which are indicated by points). (D) Color map of pSmad1 and pSmad5 distribution along a normalized cushion radius within 10 regions of interest of equal area. n=3-8 cushions per group with two slices per cushion around 30 μm. T, tensile stress; U, unloaded; C, compressive stress. *P<0.05, **P<0.01 (ANOVA with Tukey's post-hoc test).

