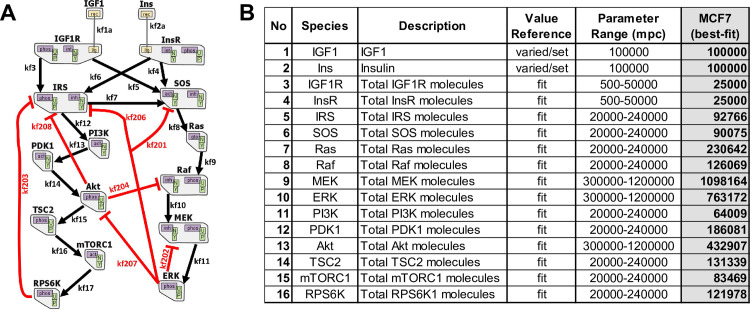
Fig 1. The computational mechanistic model representation.
(A) The topology of the dual IGF1R/InsR signaling network is illustrated. The model includes 16 proteins. Black arrows represent activation, and red lines indicate inhibition of the corresponding active molecule. The graph is adapted from RuleBender software. (B) The initial molecule numbers of the species in the model. The ranges of parameter values and the “best-fit” values are reported. mpc: molecules per cell.

