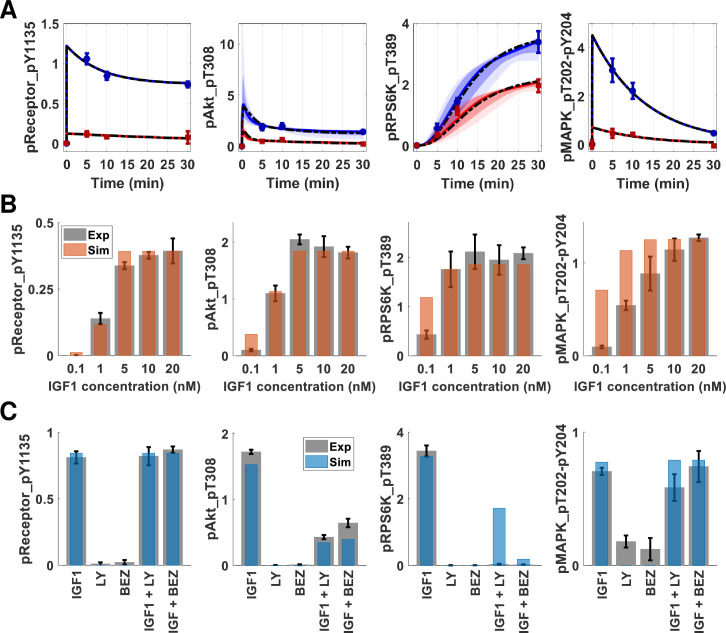
Fig 2. The mechanistic model training and test performance on multiple omics datasets show qualitative and quantitative agreement.
(A) The time course trajectories of IGF1 (blue) and insulin (red) stimulations. The ODE model was simulated 10000 times with an ensemble of parameter sets with different total protein numbers. The initial amounts of proteins were sampled using Latin Hypercube Sampling. The plots show 5%-95% (light) and 15%-85% (dark) confidence intervals for IGF1 (blue) and insulin (red) models. The circles with error bars are the corresponding RPPA data points. The dashed black lines are the trajectories for “best-fit” parameter sets. (B) The computational model (orange bars) recapitulates experimental IGF1 dose-response data (gray bars). The error bars represent the standard error of the mean from three independent biological replicates. The y-axis represents scaled protein numbers. (C) The computational model (blue bars) recapitulates PI3K inhibition data (gray bars). The columns of the x-axis correspond to IGF1: IGF1 (10 nM) stimulation, LY: first inhibitor only, BEZ: second inhibitor only, IGF1+LY: first inhibitor and IGF1 (10 nM), and IGF1+BEZ: second inhibitor with IGF1 (10 nM) stimulation. The receptor and MAPK phosphorylation are not affected by PI3K or mTORC1 inhibition, whereas Akt and S6 kinase phosphorylation decrease. The inhibitions are simulated in the computational models as a 90% reduction in the corresponding rate constant(s). The error bars represent the standard error of the mean from three independent replicates. The y-axis represents scaled protein numbers.

