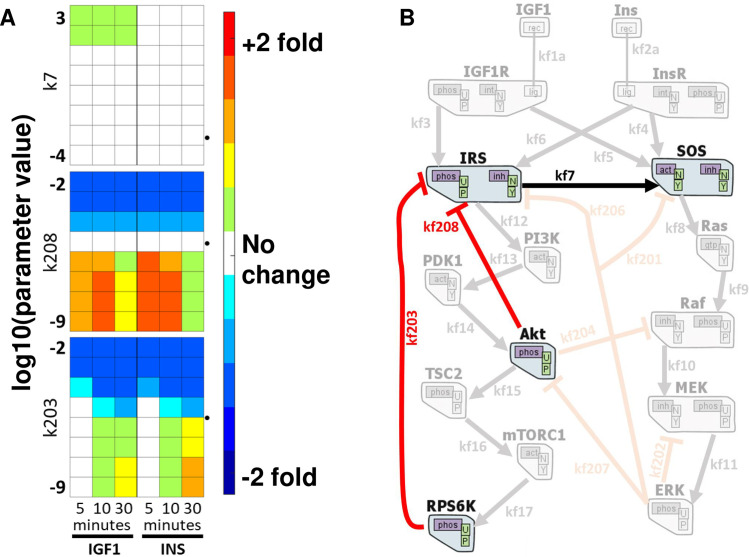
Fig 3. In silico perturbation of rate constants reveal differential effects on Akt and MAPK phosphorylation.
The model output of pMAPK and pAkt levels are determined by setting and changing the value of each parameter individually, from zero to infinity. Each box above is for a parameter, and each column is for a single time point response of 5, 10, and 30min. The left three columns are from IGF1 stimulation results, and the right three columns are from insulin stimulated simulations. The rows represent the log10 of the set parameter value, and the colors denote the log2 fold change from the unperturbed model output (red: up-regulation, blue: down-regulation). The dotted arrowheads indicate the unperturbed model parameter values in log10. The rest of the parameter perturbation scanning results are shown in S8 Fig. (B) The respective edges from (A) are depicted together to emphasize that all perturbations leading to differential regulation are concentrated on IRS proteins.

