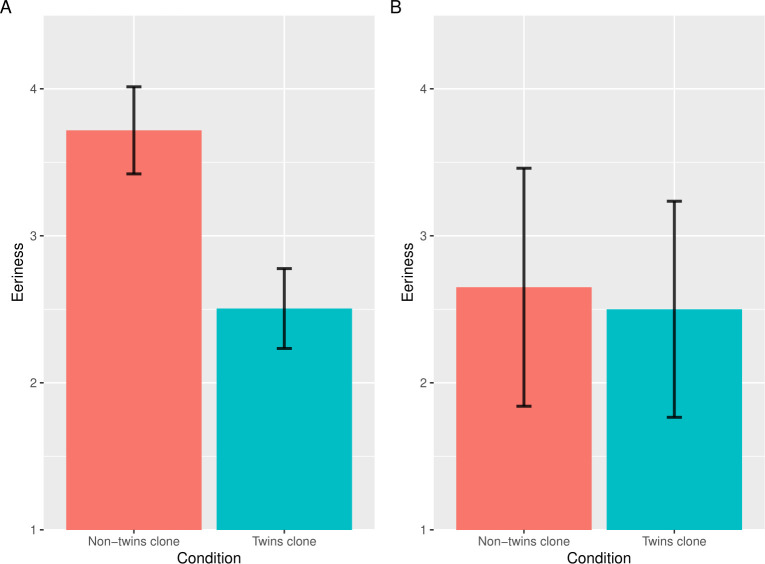
Fig 5. The results of the eeriness and realism evaluation in Study 4a.
Error bars indicate the standard errors of the mean. Both of the vertical axes indicate the mean eeriness for images in each condition. The left graph was created from the data of the participants who knew all the people in the images (A). The right graph was created from the data of the participants who did not know any of the people in the images (B).

