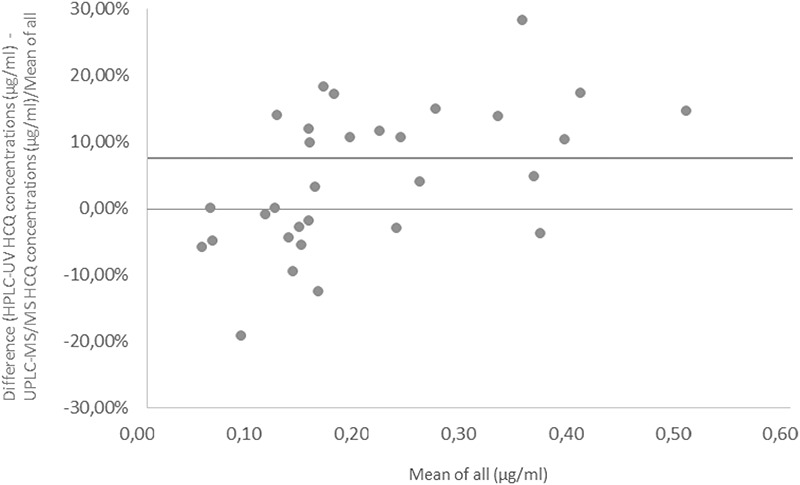
FIGURE 2.

Plot of the percentage difference between the HCQ concentrations measured using HPLC-UV and the UHPLC-MS/MS. The mean difference (bias) is represented using a solid line.

Plot of the percentage difference between the HCQ concentrations measured using HPLC-UV and the UHPLC-MS/MS. The mean difference (bias) is represented using a solid line.