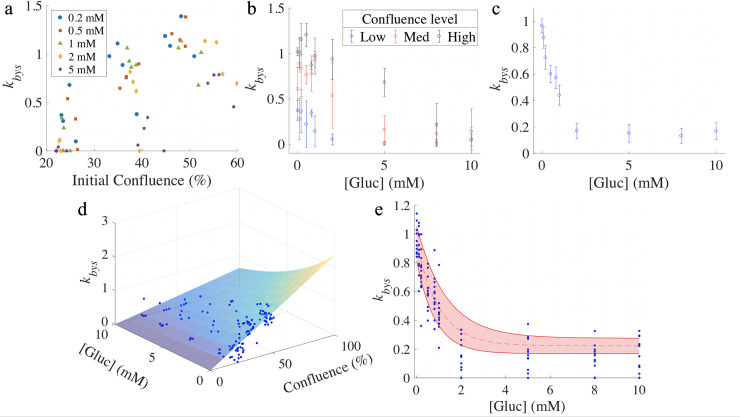
Fig 3. Relationship between bystander effect death rate (kbys) and initial conditions.
Panel a presents estimates of the death rate due to the bystander effect, kbys, as a function of different initial confluence and glucose levels for BT-474 cells. For each glucose level, kbys increases with higher initial confluence, where the lowest initial glucose level increases kbys the most. Panel b indicates that kbys increases with higher initial confluence and decreases with higher initial glucose level for the BT-474 line. (Error bars were calculated from the four wells with similar initial conditions.) Panel c shows that kbys decreases with higher initial glucose level for the MDA-MB-231 cell line. (Error bars were calculated from the twelve wells with same initial glucose level.) Panel d shows the parameter surface for the BT-474 cell line, where kbys is displayed as function of initial confluence and glucose level, with blue dots representing calibrated estimates of kbys. Panel e indicates how kbys decreases with initial glucose level for the MDA-MB-231 line, with shaded area between solid red curves showing the 95% confidence interval. The blue dots represent the calibrated estimates of kbys. The fitted surface and curve in panels d and e, respectively, is used to assign kbys as a function of initial confluence and glucose concentration in the validation data set.

