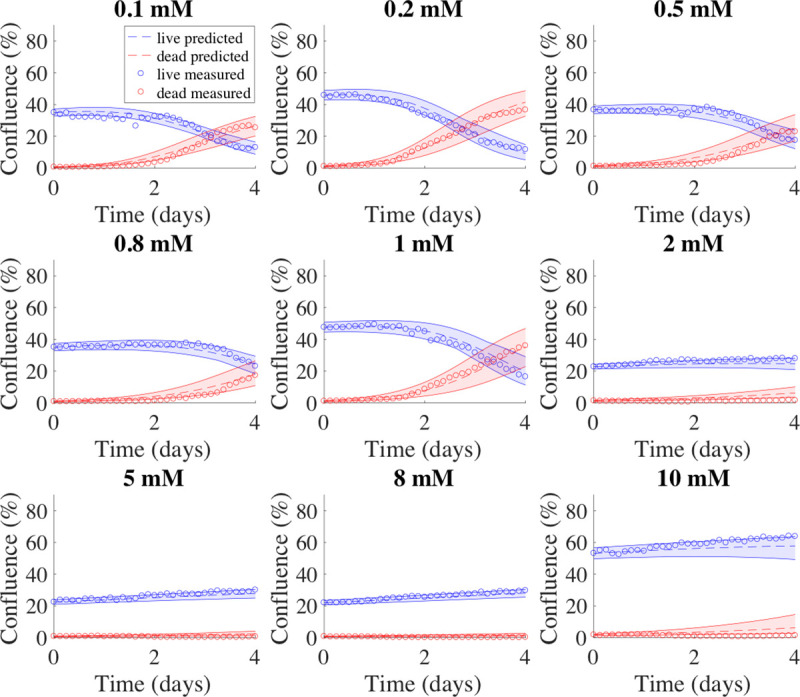
Fig 4. Model predictions for BT-474 cells.

Example model predictions from one validation set of BT-474 cells are shown in dashed lines. In each panel, data measured from experiments are shown in circles, while the 95% confidence intervals for the predicted tumor cell growth and dead cell accumulation numbers are shown with shaded regions between the solid curves; with blue indicating live cells, and red indicating dead cells. The initial glucose level is shown above each plot. For this validation set, the model prediction accuracy was 72.2 ± 8.6% and 49.3 ± 10.0% for live and dead cells, respectively.
