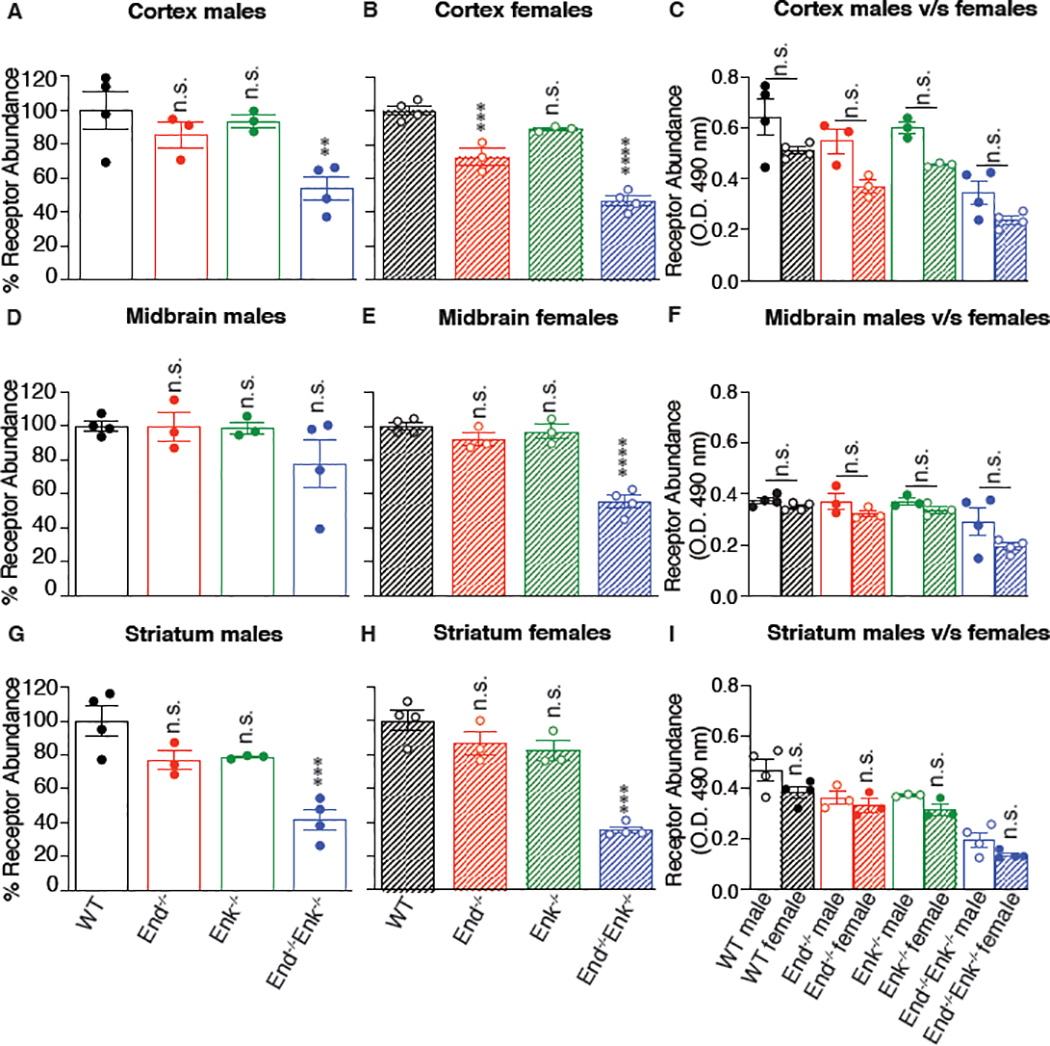
Figure 7. κOR levels in the cortex, midbrain, and striatum of wild-type, End−/−, Enk−/−, and End−/−/Enk−/−mice.
Membranes (10 μg) from the cortex (A-C), midbrain (D-F), and striatum (G-I) from male (A, D, G) and female (B, E, H) wild-type (WT), End−/−, Enk−/−, End−/−/Enk−/− mice were subjected to ELISA using monoclonal antibodies selective for κOR (7AG-9). Values obtained with wild-type membranes were taken as 100 %. One-Way ANOVA with Dunnett’s multiple comparison tests v/s WT. (C, F, I) Comparison of δOR levels between males and females. Two-Way ANOVA with Sidak’s multiple comparison tests; **p<0.01; ***p<0.001, ****p<0.0001. Data represent Mean ± SE of 3–4 animals in triplicate.

