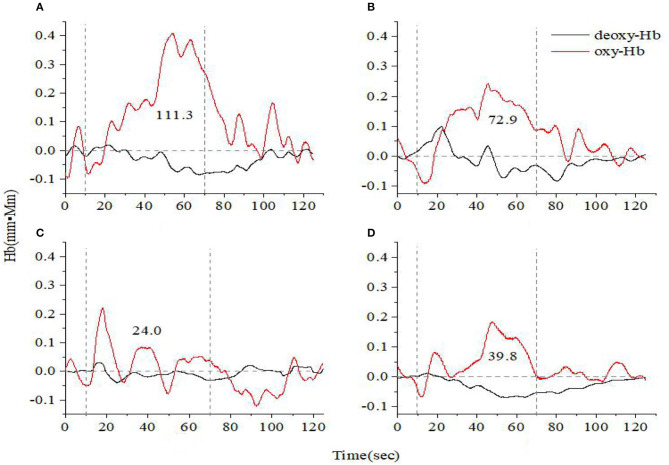
Figure 1.
Time course of hemoglobin concentration changes in a representative healthy control (A) and a representative anxiety and depression patient at the acute (B), consolidation (C), and maintenance stages (D). All of them completed the verbal fluency task. The red line indicates the amount of change in oxyhemoglobin concentration (oxy-Hb), and the black line indicates the amount of change in deoxyhemoglobin concentration (deoxy-Hb). The numbers indicate integral values.

