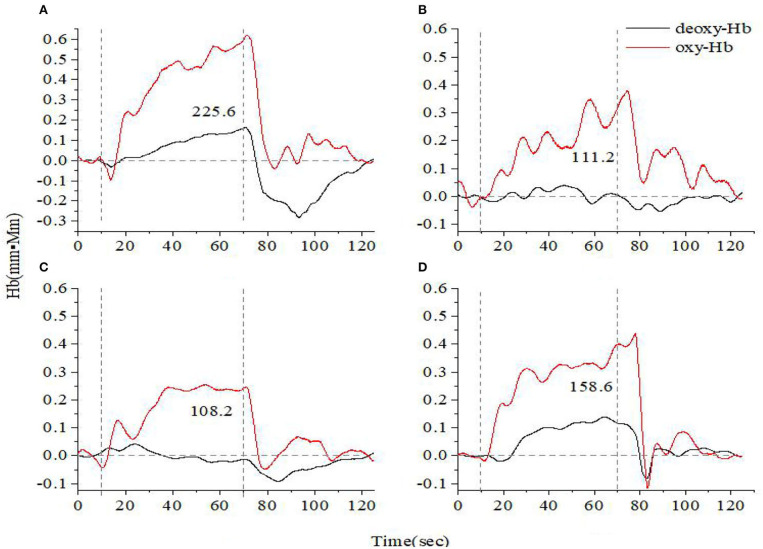
Figure 2.
Time course of hemoglobin concentration changes in a representative healthy control (A) and a representative anxiety and depression patient at the acute (B), consolidation (C), and maintenance stages (D). All of them completed the high-level cognition task. The red line indicates the amount of change in oxyhemoglobin concentration (oxy-Hb), and the black line indicates the amount of change in deoxyhemoglobin concentration (deoxy-Hb). The numbers indicate integral values.

