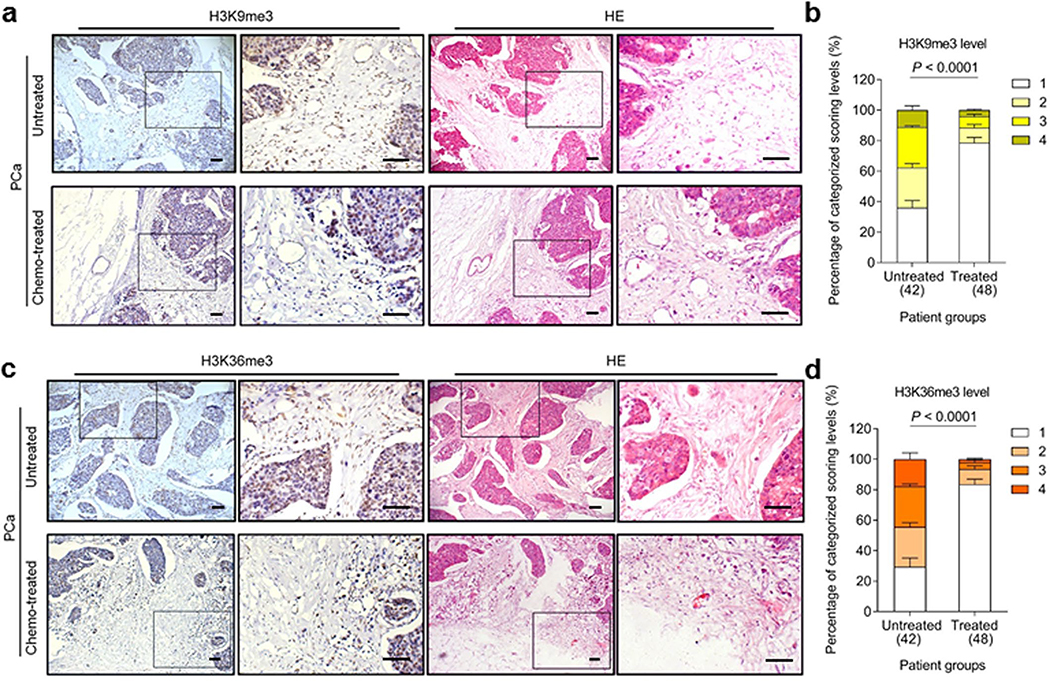
Extended Data Fig. 2 |. H3K9me3 and H3K36me3 levels decline in human prostate tumor stroma.
a, Histological images of H3K9me3 staining in the stroma of human prostate cancer (PCa) tissues. Upper, before chemotherapy; lower, after chemotherapy. Left panel, immunohistochemical (IHC) staining; right panel, hematoxylin and eosin (HE) staining. Rectangular regions per left images are amplified into corresponding right images. Scale bars, 100 μm. b, Pathology-based statistical assessment of stromal H3K9me3 signal intensity in PCa samples (42 untreated versus 48 treated). In each group, patients were histologically assigned into 4 categories per IHC staining intensity of H3K9me3 in tumor stroma. 1, negative; 2, weak; 3, moderate; 4, strong expression. c, Histological images of H3K36me3 staining in the stroma of human PCa tissues. Upper, before chemotherapy; lower, after chemotherapy. Left panel, IHC staining; right panel, HE staining. Rectangular regions per left images are amplified into corresponding right images. Scale bars, 100 μm. d, Pathology-based statistical assessment of stromal H3K36me3 signal intensity in PCa samples (42 untreated versus 48 treated). In each group, patients were histologically assigned into 4 categories per IHC staining intensity of H3K9me3 in tumor stroma. 1, negative; 2, weak; 3, moderate; 4, strong expression. Data in all bar plots are shown as mean ± SD and representative of 3 biological replicates. Data in a-g are representative of 3 biological replicates. b and d, P values were determined by two-way ANOVA with Bonferroni’s post-hoc test.

