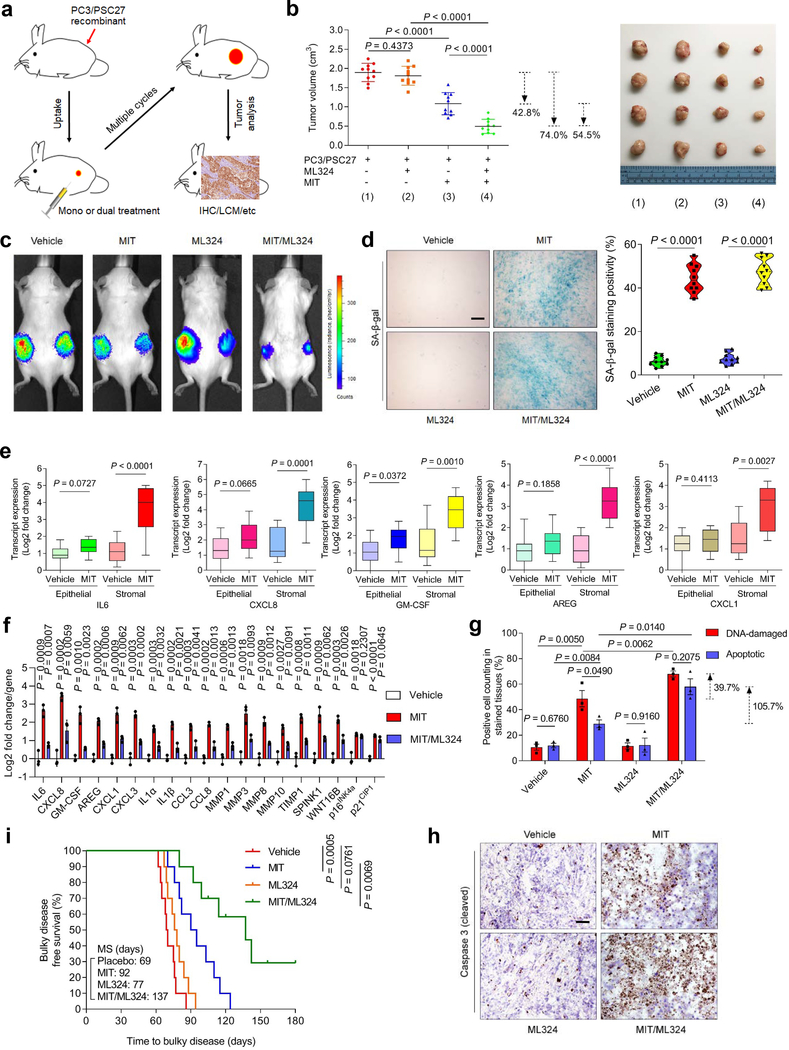
Fig. 7. Therapeutically Targeting KDM4 in the Damaged TME Diminishes Cancer Resistance Conferred by Senescent Stroma.
a, Illustrative diagram for preclinical treatment of NOD/SCID mice. Two weeks after subcutaneous implantation and in vivo uptake of tissue recombinants, animals received either single (mono) or combinational (dual) agents administered as metronomic treatments. b, Statistical profiling of tumor end volumes. PC3 cells were xenografted alone or together with PSC27 cells. MIT was administered to induce tumor regression, alone or together with ML324. Right, representative images of tumors. c, Representative bioluminescence imaging (BLI) of PC3/PSC27 tumor‐bearing animals. Digital signals were proportional to in vivo luciferase activities measured by an IVIS device. d, Comparative imaging of in vivo senescence of tumor tissues by SA-β-gal staining. Scale bars, 200 μm. Right, violin plot of positivity statistics. e, Transcript assessment of in vivo expression of several canonical SASP factors in stromal cells isolated from tumors of NOD/SCID mice. Statistics performed with two-sided Mann-Whitney U-test, with upper and lower hinges representing 25th and 75th percentiles. Horizontal bars show the median value, and whiskers extend to the values no further than 1.5 ☓ IQR from either upper or lower hinge. f, Quantitative appraisal of SASP factor and senescence marker expression in stromal cells isolated from tumor tissues of animals. Signals per factor were normalized to vehicle-treated group. g, Statistical assessment of DNA damaged and apoptosis in preclinical biospecimens. Values presented as percentage of cells positively stained with antibodies against γ‐H2AX or caspase 3 (cleaved). h, Representative histological images of caspase 3 (cleaved) in tumors at the end of therapeutic regimes. Scale bars, 100 μm. i, Survival appraisal of mice sacrificed upon development of advanced bulky diseases. Survival duration calculated from the time of tissue recombinant injection until the day of death. Data analyzed by a two-sided log-rank (Mantel-Cox) test. Data in all bar plots shown as mean ± SD and representative of 3 biological replicates. b (left panel) and d (right panel), f and g, P values from two-sided unpaired t-test, and adjusted for multiple comparisons. Data in h are representative of 3 biological replicates.

