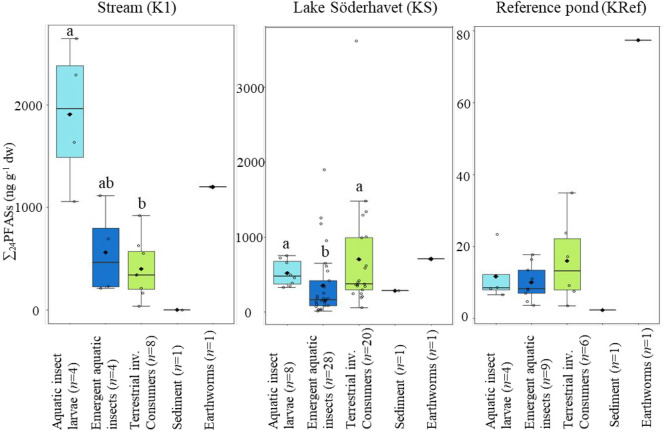
Figure 3.
Sum of 24 PFAS (ng g–1 dw) in different groups from the stream (K1), the lake (KS), and the reference pond (KRef). The groups aquatic insect larvae, sediment, and earthworms were collected in fall 2017; terrestrial invertebrate consumers in spring 2017; and emergent aquatic insect in spring 2017 and 2018. Circles represent data points, diamonds represent mean values, and the band represents the median. Lower and upper hinges correspond to the first and third quantiles (25th and 75th, respectively). The lower and upper whiskers extend from the hinge to the smallest and the largest value no further than 1.5 times the interquartile range (IQR). Groups at each site that do not share the same letters have significantly different concentrations (Dunn’s test, p < 0.05, no significant differences were found in Kref). Sediment and earthworms were excluded from the statistical analysis due to too few samples. Note the differences in scales between KRef and the other two sites.

