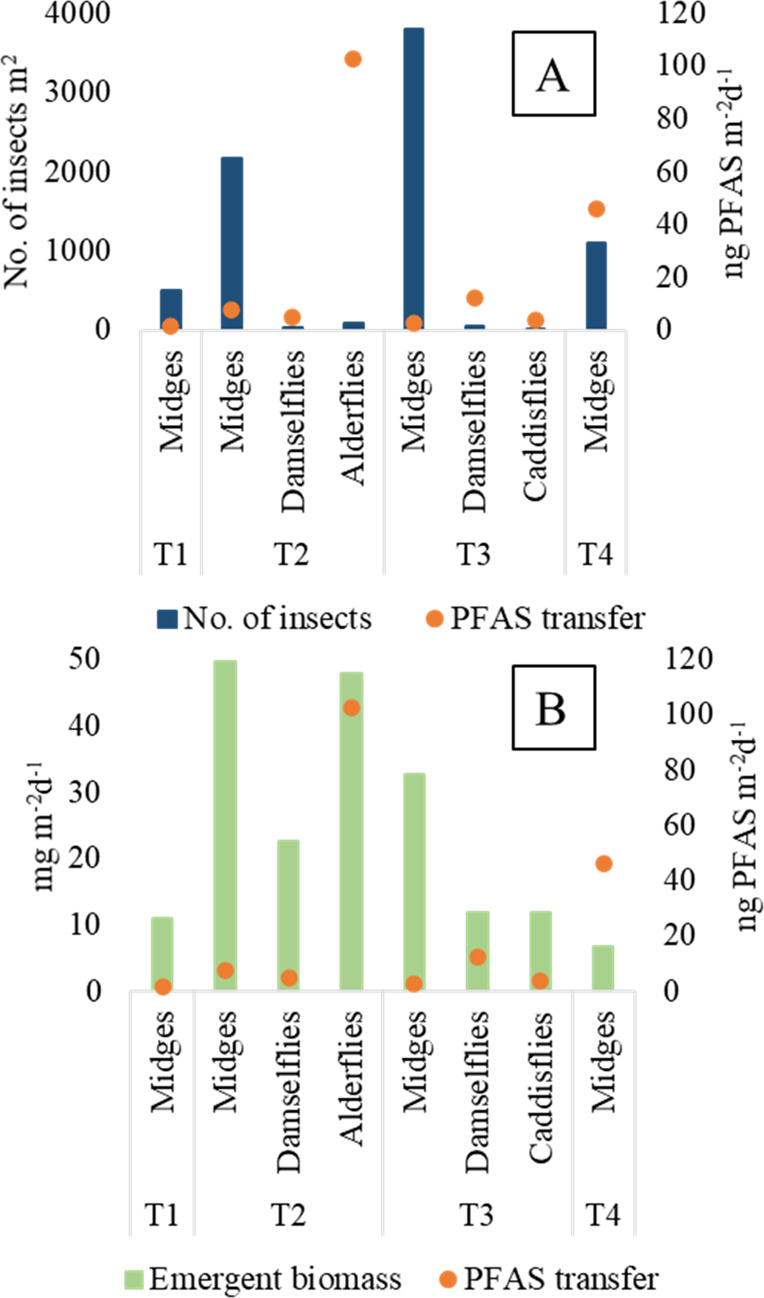
Figure 4.

(A) Total number of emergent insects per m2 collected during each time period T1–T4 (blue bars) and (B) total emergent biomass mg per m2 during time periods T1–T4 (green bars) along with the estimated amount of daily transfer of PFAS (ng ∑24PFAS per m2) for each insect group at the riparian zone of Lake Söderhavet 2018. Only samples collected from deposition traps were used.
