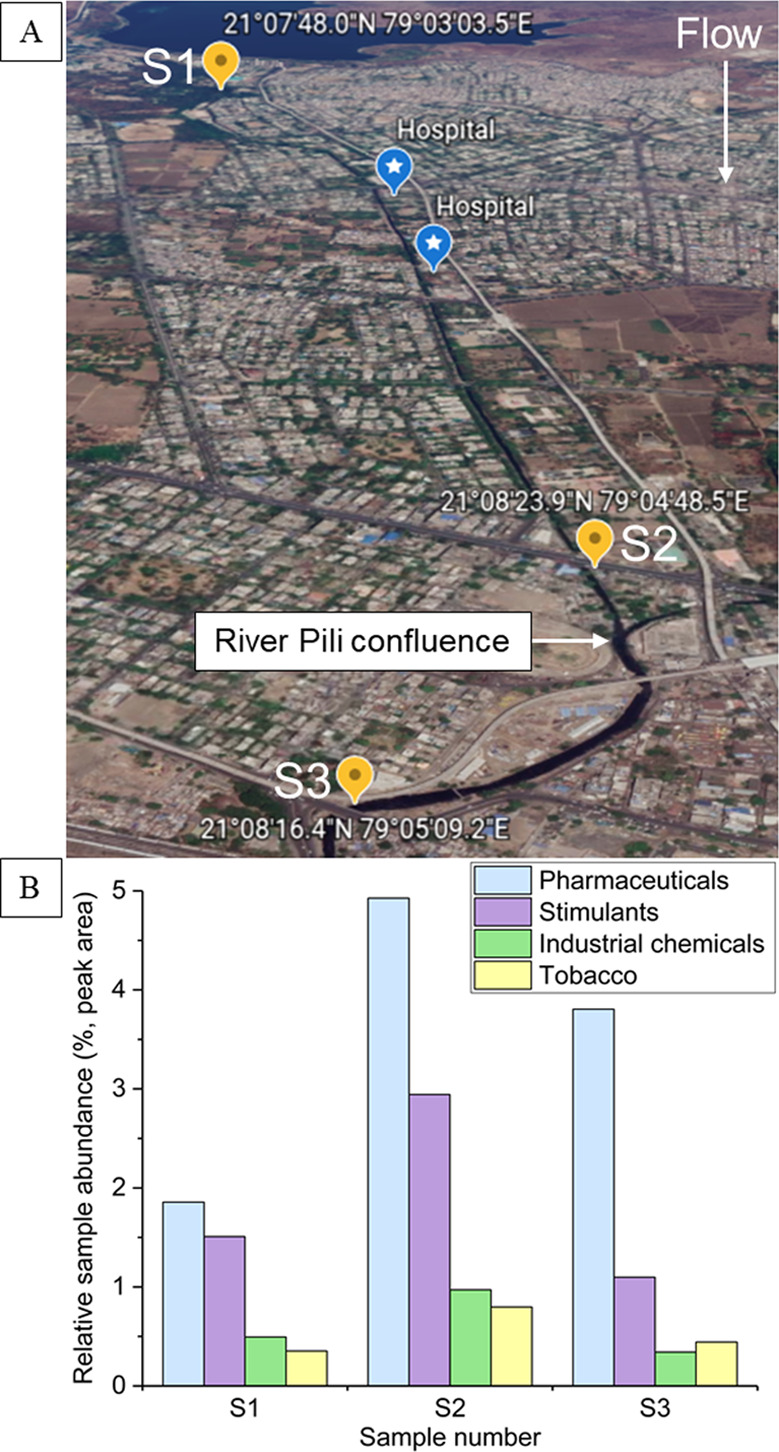
Figure 3.

Surface water sampling locations in the River Nag, India (A) and the detected pollutants in each sample with spectral matches >85% confidence (assigned by the commercial mass spectral library, mzCloud) grouped by their potential sources (see Analysis of Surface Waters and Table S11 for further information). The directional flow of the river Nag is shown, along with the confluence of the river Pili. The sample numbers correspond to Table S3. The percentage relative sample abundance was calculated by dividing the measured peak area of each compound by the total sample peak area and multiplying by 100.
