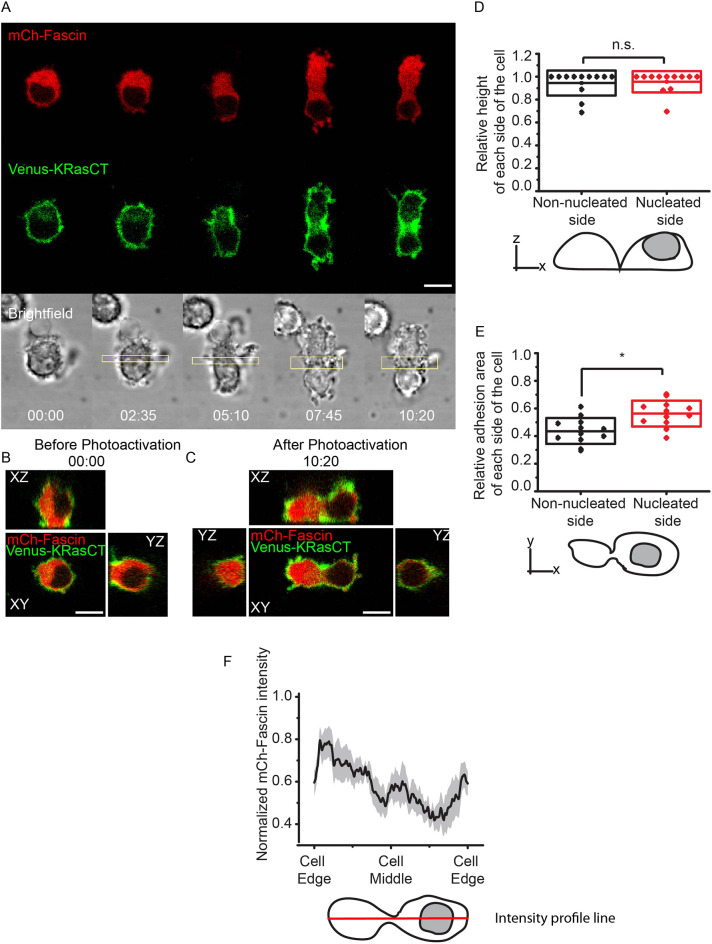
Fig. 3.
Fascin overexpression maintains cell height during cell shape changes associated with furrow formation. (A) Confocal images of cell shape changes via optogenetic activation of RhoA. Mononucleated cell is expressing LARG-mTurq-SspB, iLID-CaaX, the nuclear marker fascin-mCh (red) and Venus-KRasCT (green). Image is representative of 47 out of 51 single confocal images of different cells. (B) Orthogonal views of the cell in A prior to photoactivation. Images were reconstructed from a 51-plane z-stack. (C) Orthogonal views of the cell in A after photoactivation. Images were reconstructed from a 51-plane z-stack. (D) Relative height of non-nucleated and nucleated side after photoactivation. ‘Relative height’ is defined as the height of the side in question divided by the maximum height of the cell. The box represents s.d. n=12, 51-plane z-stack images. n.s., not significant; P=0.819, paired Student's t-test. (E) Relative adhesion area of non-nucleated and nucleated side after photoactivation. ‘Relative adhesion area’ is defined as the adhesion area of the side in question divided by the total adhesion area of the cell. The box represents s.d. n=12. *P=0.0411, paired Student's t-test. (F) Normalized fascin-mCh intensity profile along the length of the cell. n=14. Shaded region represents s.e.m. The scheme shows the intensity profile line in red, to quantify the fascin distribution across the cell. Rectangles represent the area of photoactivation. Scale bars: 10 μm. Time is in min:s.

