
FIGURE 2.
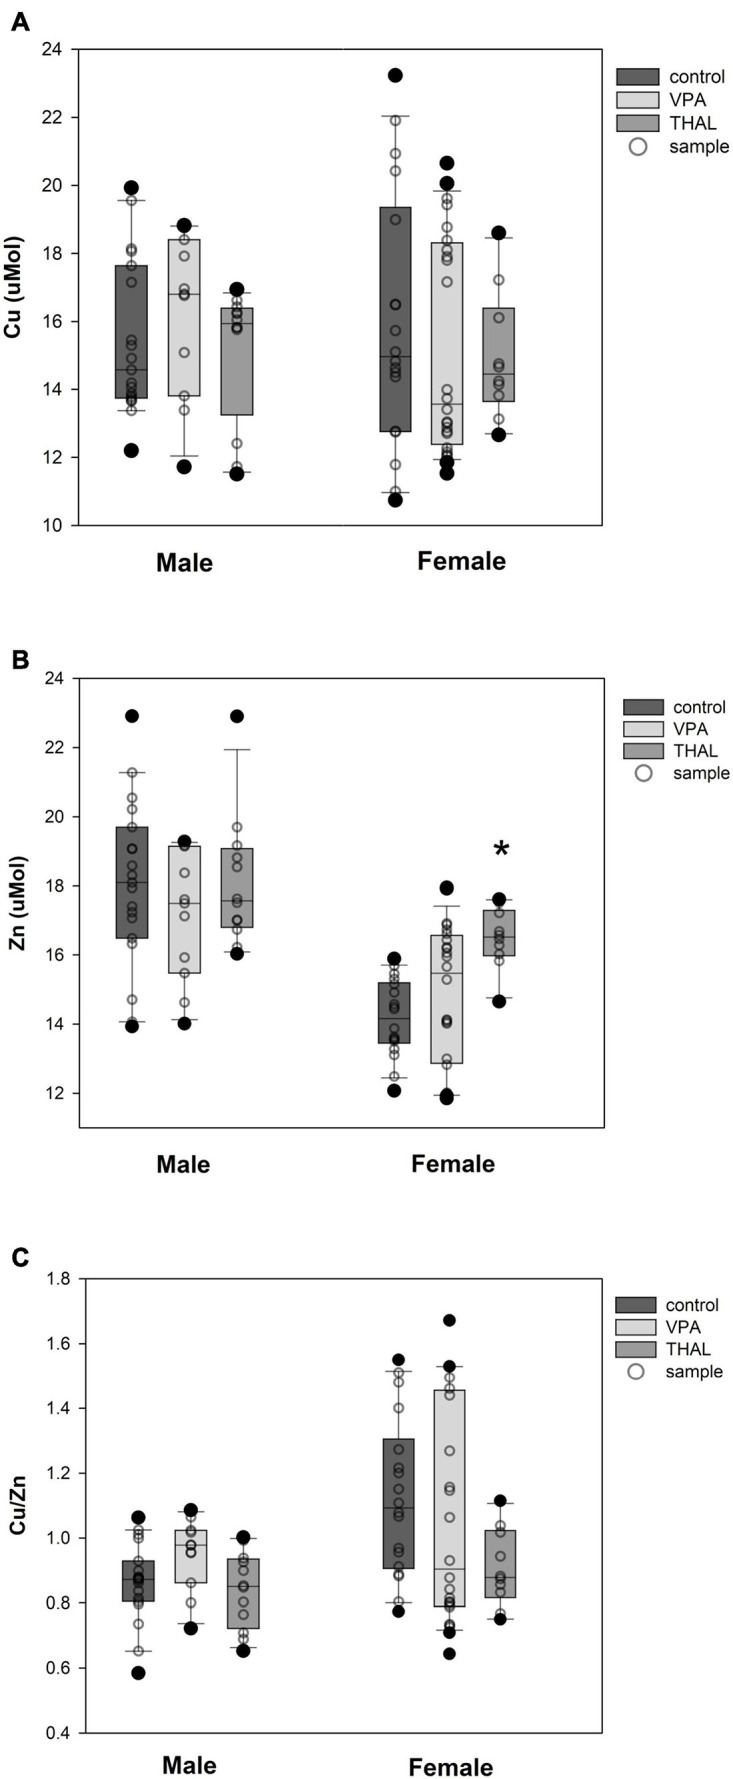
Box and Whiskers plot of changes in Cu (A), Zn (B), and Cu/Zn (C) levels in rats’ serum measured using the ICP-MS method. The obtained results are expressed in μM concentration (A,B). Number of samples: n = 37 (18F + 19M) – control group, n = 35 (24F + 11M) – VPA-treated rats, and n = 22 (10F + 12M) – THAL-treated animals; F – female; M – male rats; (*) represents results statistically significant vs. control, p < 0.05, one-way ANOVA followed by Holm-Sidak corrections; box containing 50% of results that fell in the range between 25% (bottom line) and 75% (top line) – IQR (InterQuartile Range), (–) median value, whiskers – min and max values, (∘) – outliers (±1.5 × IQR), (∘) – individual sample.