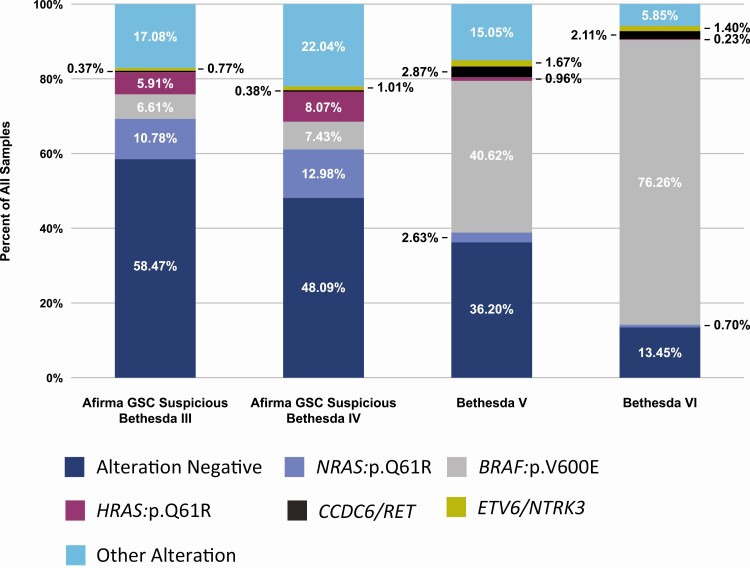
Figure 1.
Percent of alterations among Afirma Xpression Atlas Intended Use samples: Afirma GSC Suspicious Bethesda III (n = 12,356), Afirma GSC Suspicious Bethesda IV (n = 4,238), Bethesda V (n = 837), and Bethesda VI (n = 855). The three most frequent alterations in each Bethesda category were identified. The frequency of these five alterations among each Bethesda category is shown. All other alterations are shown as “Other Alteration”.  = Alteration Negative;
  = NRAS:p.Q61R;
  = BRAF:p.V600E;
  = HRAS:p.Q61R;
  = CCDC6/RET;
  = ETV6/NTRK3;
  = Other Alteration.

