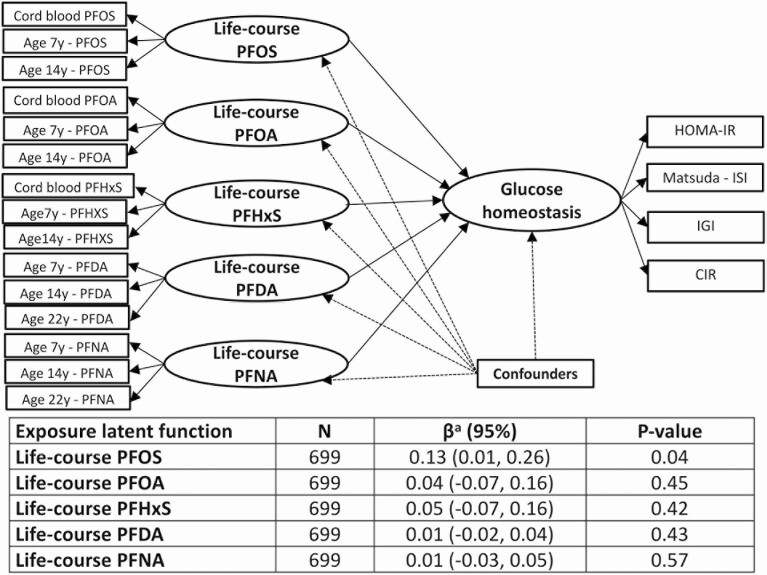
Figure 3.
Path diagram and standard error of the mean effect estimates for the association between life-course latent PFAS exposure functions and the latent glucose homeostasis function estimated based on observed markers of insulin sensitivity and beta-cell function. aChange in the standard deviation of the glucose homeostasis function per 1 SD increase in life-course PFAS exposures, adjusted for sex, order of birth, maternal prepregnancy BMI, maternal smoking and fish intake during pregnancy, and breastfeeding duration.

