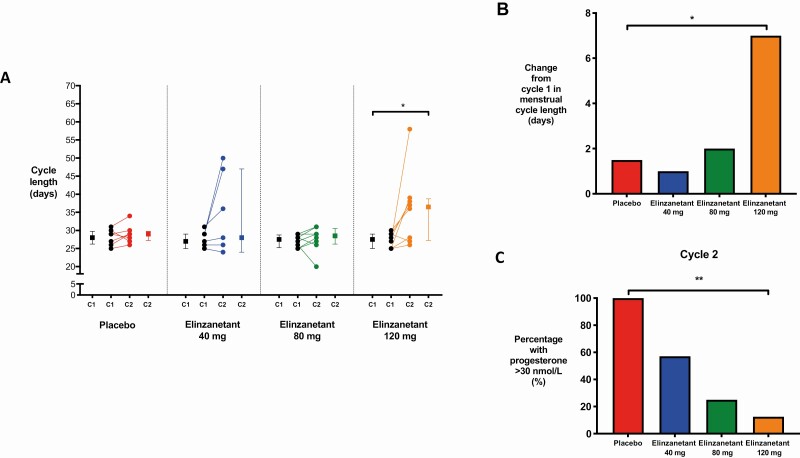
Figure 4.
Menstrual cycle length and biochemical parameters of ovulation in women receiving placebo or elinzanetant during the study. A, The change in menstrual cycle length between cycles 1 (C1) and 2 (C2) after treatment with placebo (N = 8, red), elinzanetant 40 mg (N = 7, blue), 80 mg (N = 8, green), and 120 mg (N = 8, orange) in healthy women. Data in graphs depict within-participant paired raw data and the group median and interquartile range. *P less than .05, Wilcoxon rank sum test. B, The median change between cycles 1 and 2 in menstrual cycle length (days) in healthy women after placebo (N = 8, red), elinzanetant 40 mg (N = 7, blue), 80 mg (N = 8, green), and 120 mg (N = 8, orange). *P less than .05, Wilcoxon rank sum test. C, The percentage of healthy women with a serum progesterone greater than 30 nmol/L in cycle 2 after placebo (N = 8, red), elinzanetant 40 mg (N = 7, blue), 80 mg (N = 8, green), and 120 mg (N = 8, orange). **P less than .01, chi-square test.

