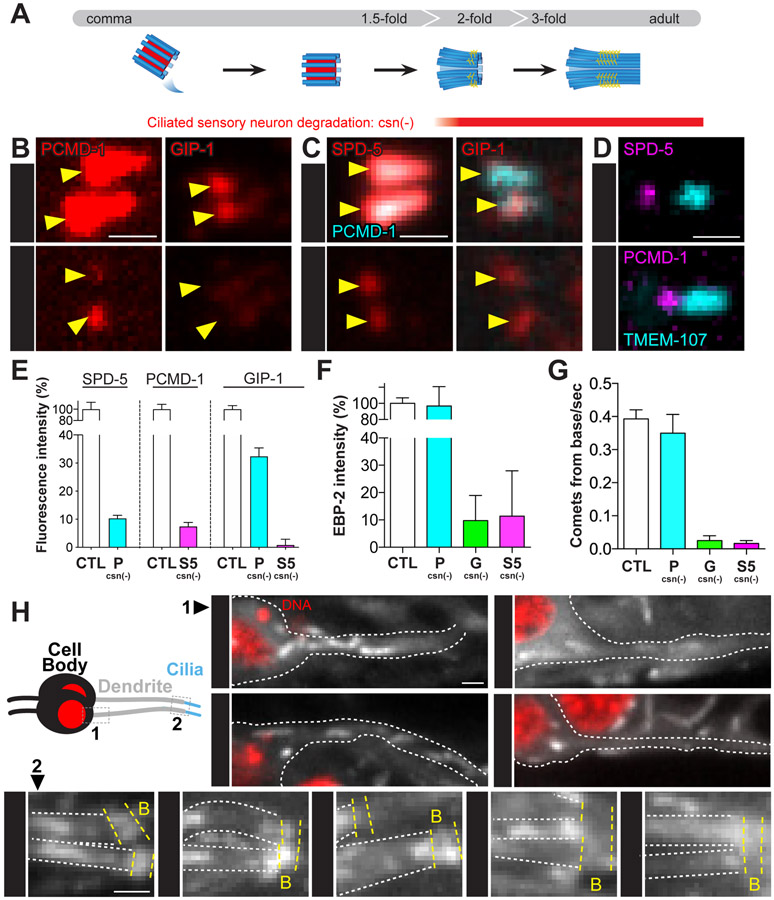
Figure 4. SPD-5 drives MTOC function at the ciliary base and ciliogenesis.
(A) Cartoon of ciliogenesis in phasmid neurons with centriolar microtubules (blue), internal centriole structures (red), and transition zone fibers (yellow) indicated. The osm-6 promoter drives ciliated sensory neurons specific degradation (csn(−)). (B-D) Localization of indicated proteins at the ciliary base (yellow arrowhead) of adult phasmid cilia following SPD-5 or PCMD-1 depletion. (E) Analysis of fluorescence intensity of indicated proteins following degradation of SPD-5 or PCMD-1. SPD-5: control (‘CTL’) = 100±12.45%, n= 10 worms; PCMD-1csn(−) (‘P csn(−)’) = 10.32±1.06%, n= 14 worms; PCMD-1: control = 100±8.83%, n= 11 worms; SPD-5csn(−) (‘S5 csn(−)’) = 7.45±1.39%, n= 12 worms; GIP-1: control = 100%±6.41, n= 10 worms; PCMD-1csn(−) = 32.36±3.01%, n= 10; SPD-5csn(−) = 0.82±2.09%, n= 10 worms. Values are mean ± standard error of mean. (F) EBP-2 fluorescence intensity near the ciliary base relative to control: control = 100± 6.87%, n= 10 worms; PCMD-1csn(−) = 96.85±23.8%, n= 10 worms; GIP-1csn(−) (‘G csn(−)’) = 9.74±9.25%, n= 10 worms; SPD-5 csn(−) = 11.35±16.6%, n= 10 worms. (G) EBP-2 comets emanating from ciliary base: control = 0.40±0.03 comets/sec., n= 10 worms; PCMD-1csn(−) = 0.35±0.06 comets/sec., n= 10 worms; GIP-1csn(−) = 0.03±0.01 comets/sec., n= 10 worms; SPD-5csn(−) = 0.02±0.01 comets/sec., n= 10 worms. (H) Cartoon of phasmid neuron with region imaged along the dendrite (‘1’) and at the ciliary base (‘2’) indicated. 1: 12-second time-projection of EBP-2 comets in the dendrite moving toward the cell body (red, DNA). 2: 3-second time-projection of EBP-2 comets along the dendrites (outlined by white dashed lines, ‘D’) near the ciliary base (yellow dashed lines, ‘B’). Scale bars = 1μm.

