FIGURE 4.

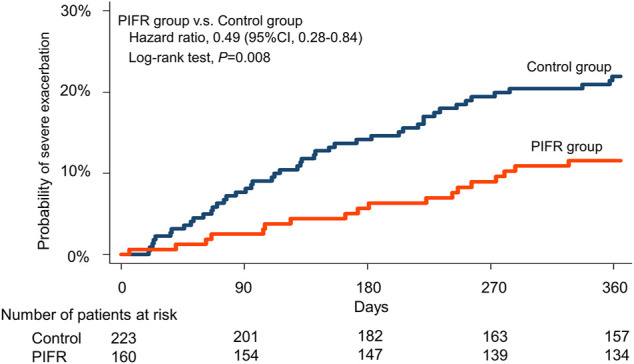
Kaplan-Meier time-to-event plot and log-rank test for time to first severe acute exacerbation among PIFR group and control group.

Kaplan-Meier time-to-event plot and log-rank test for time to first severe acute exacerbation among PIFR group and control group.