. 2021 Jun 29;10:e65764. doi: 10.7554/eLife.65764

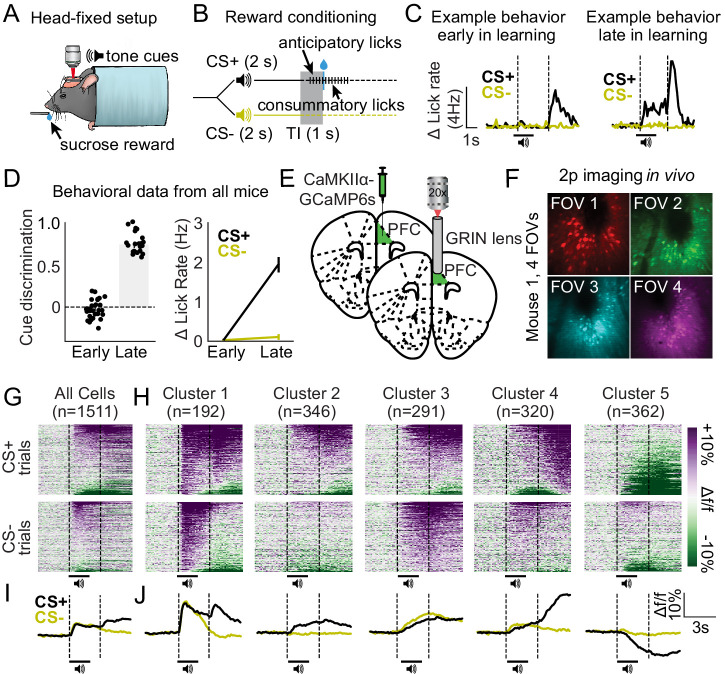
Figure 1. Distinct excitatory neuronal ensembles revealed in dorsomedial prefrontal cortex (dmPFC) during head-fixed Pavlovian conditioning.

(A) Illustration of head fixation for reward conditioning experiments with concurrent two-photon imaging. (B) Schematic for reward conditioning experiments, in which the CS+ and CS- are presented in a random order 50 times each. The CS+ denotes the availability of a liquid sucrose reward following a 1 s trace interval (TI). Anticipatory licks are seen during the trace interval in well-trained mice. (C) Example behavior data during early in learning (left) vs. late in learning (right) behavioral sessions. (D) Cue discrimination scores (auROC; CS+ vs. CS-) and change in lick rate for each cue during early and late in learning behavioral sessions. Data presented as mean ± SEM. (E–F) Surgery schematic (E) allowing for in vivo imaging of GCaMP6s-expressing neurons (F). (G–H) Heat maps displaying the responses of all dmPFC neurons (G) and responses separated by cluster (H) aligned to the cues. (I–J) Line plots displaying the mean activity traces of all cells (I) and mean activity of all cells separated by cluster (J).

Figure 1.

Figure 1—figure supplement 1. Behavioral task acquisition across days for each mouse.
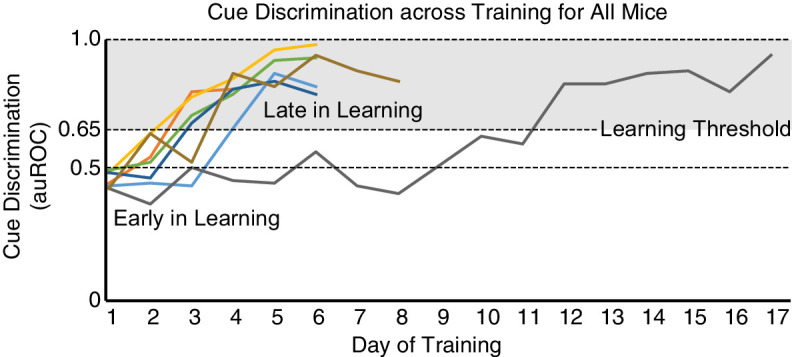
Figure 1—figure supplement 1.

Cue discrimination (CS+ vs. CS- trials; normalized auROC) scores for each mouse plotted across days. Early in learning is defined as any session before a score of 0.3 or above is reached. Late in learning is defined as any session on days thereafter, wherein a score above 0.31 is achieved.
Figure 1—figure supplement 2. Visualizing dorsomedial prefrontal cortex (dmPFC) excitatory neurons within unique fields of view (FOVs) in a single mouse.
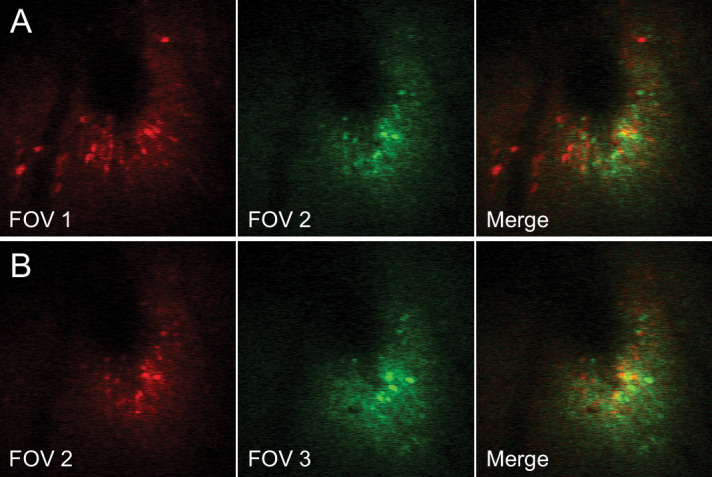
Figure 1—figure supplement 2.

(A–B) Images show GCaMP6s expression in dmPFC at multiple Z-planes, each separated by 50 µm along the Z-axis. Images are color coded red (left) or green (middle) to allow assessment of overlapping neurons (right). The lack of overlap in fluorescence between FOV 1 and FOV 2 (A), and between FOV 2 and FOV 3 (B) confirms visualization of unique neurons in each FOV.
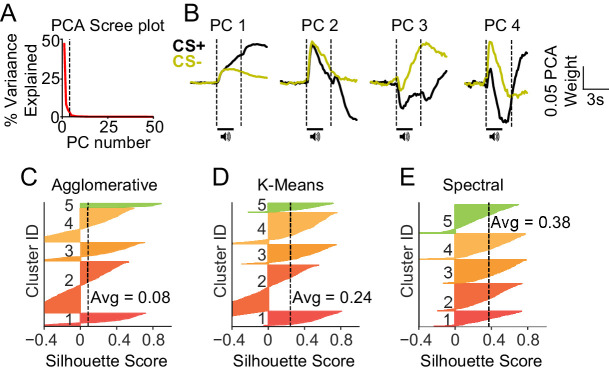
Figure 1—figure supplement 3. Principal components analysis (PCA)-based clustering reveals unique silhouette scores for different clustering models.

Figure 1—figure supplement 3.

(A–B) PCA scree plot shows variance explained by principal components (PCs) (A) and PCs formed prior to scree plot inflection point (n = 4 PCs; B). (C–E) Silhouette plots show the relative fit of each neuron for formed clusters based on agglomerative (C), K-means (D), and spectral (E) clustering models. Spectral clustering had improved average performance as compared with agglomerative and K-means models (see inset scores), and thus was used for clustering analyses as shown in Figure 1.
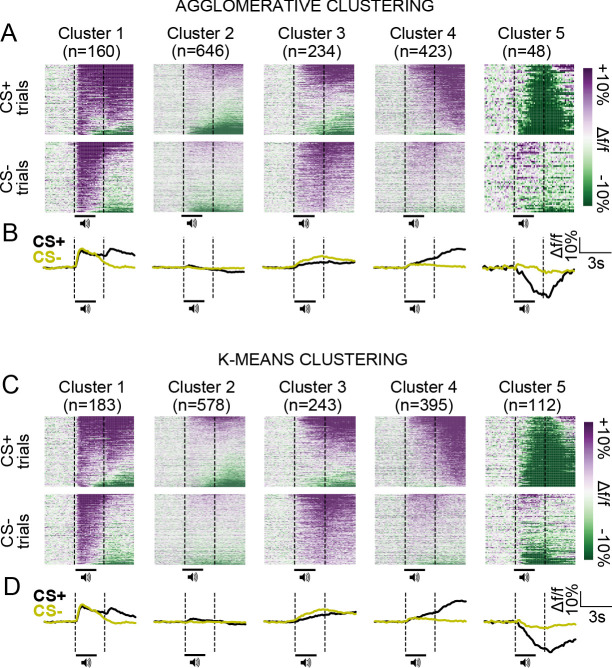
Figure 1—figure supplement 4. Similar neuronal ensembles defined by agglomerative and K-means clustering as compared with spectral clustering (see Figure 1).

Figure 1—figure supplement 4.

(A) Heat maps displaying responses in dorsomedial prefrontal cortex (dmPFC) neurons separated by cluster formed by agglomerative clustering and aligned to cues. (B) Line plots displaying the mean activity traces of cells separated by agglomerative clustering. (C) Heat maps displaying responses in dmPFC neurons separated by cluster formed by K-means clustering and aligned to cues. (D) Line plots displaying the mean activity traces of cells separated by K-means clustering.
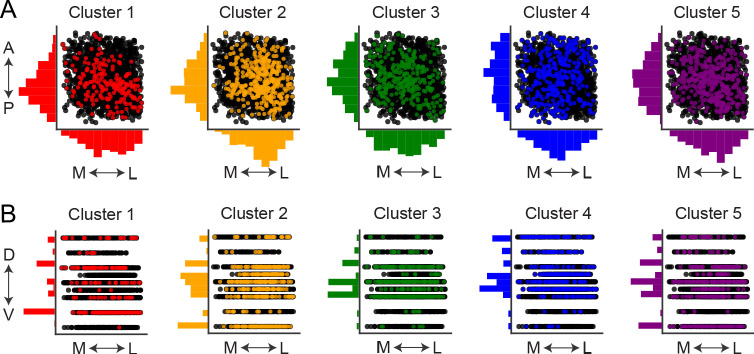
Figure 1—figure supplement 5. Estimated relative locations of each neuron across the anterior-posterior (A–P), medial-lateral (M–L), and dorsal-ventral (D–V) axes of dorsomedial prefrontal cortex (dmPFC).

Figure 1—figure supplement 5.

(A) Estimated relative locations of all recorded neurons, grouped by cluster, late in learning across A–P and M–L axes. Colored circles represent neurons classified within each cell cluster, whereas black circles are neurons classified to be within other cell clusters. These approximated locations are based on the pixel-to-pixel positions of each neuron in each field of view (FOV), averaged across FOVs. A total of 512 pixels are included across the X and Y axes. (B) Estimated relative locations of all recorded neurons, grouped by cluster, late in learning across the D–V and M–L axes. These approximated locations are based on focal distance in the D–V axis from the bottom of the GRIN lens (anywhere from 0 to 300 µm of objective movement) and pixel-to-pixel positions of each neuron in the M–L axis (including a total of 512 pixels), averaged across FOVs. Histograms along the outside of each axis represent the kernel density estimations (along 10 or fewer bins) for cell locations along each plane, normalized for each cluster. Measurements are not to scale as locations are approximate and relative (see Materials and methods).
Figure 1—video 1. Expression of GCaMP6s in dorsomedial prefrontal cortex (dmPFC) visualized via two-photon microscopy in vivo.
Download video file (3.3MB, mp4)
An example two-photon z-stack recording in vivo showing GCaMP6s expression within unique fields of view (FOVs) in dmPFC. Each FOV, visualized during pauses within the video, was separated by at least 50 μm of objective movement and was found to contain a unique set of neurons.