Figure 4. Ensemble-specific activity dynamics differentially evolve across learning.
(A) Example field of view (FOV) showing the same neurons (arrowheads) from early (top) and late (bottom) in learning sessions, tracked across days. (B) Mean activity traces during CS+ and CS- trials for each ensemble early (top row) and late (bottom row) in learning. (C) Mean responses of all tracked neurons during CS+ and CS- trials early and late in learning. (D) Responses separated by cluster reveal adaptations in CS+ and/or CS- encoding for Clusters 2–5, but no significant changes for Cluster 1. ***p-value < 0.001; **p-values = 0.01. (E) Correlation plot displaying mean responses (baseline vs. cue/reward period) of all tracked neurons during CS+ and CS- trials early and late in learning. (F) Correlation plots separated by cluster displaying the mean response of each neuron early and late in learning. Pearson-R values are displayed in the top left corner for all cells and for each ensemble (E–F). *p-value < 0.05.

Figure 4—figure supplement 1. Correlations in activity from early to late in learning are not due to similarities in activity across neurons within each field of view (FOV).
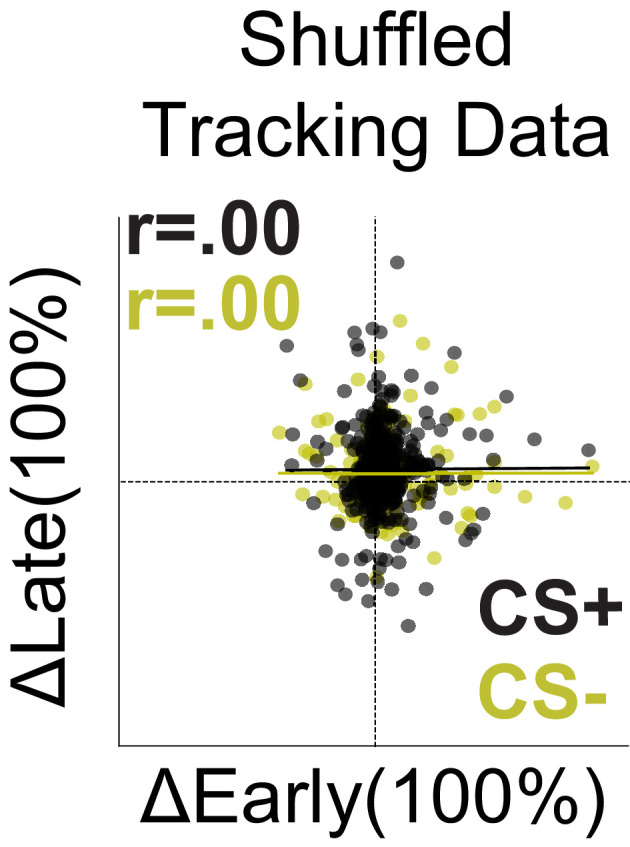
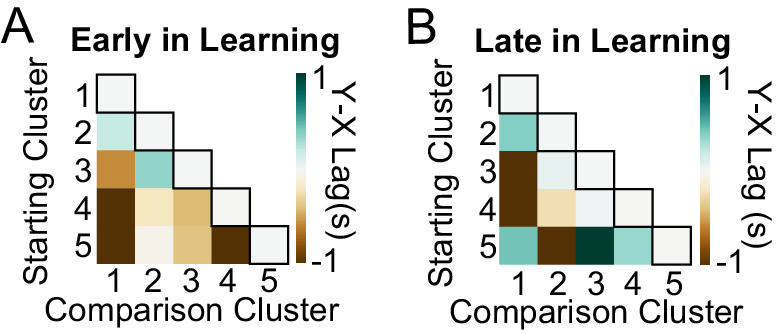
Figure 4—figure supplement 2. Average neuron-to-neuron lags reveal signal coherence between neurons of the same cluster both early and late in learning.