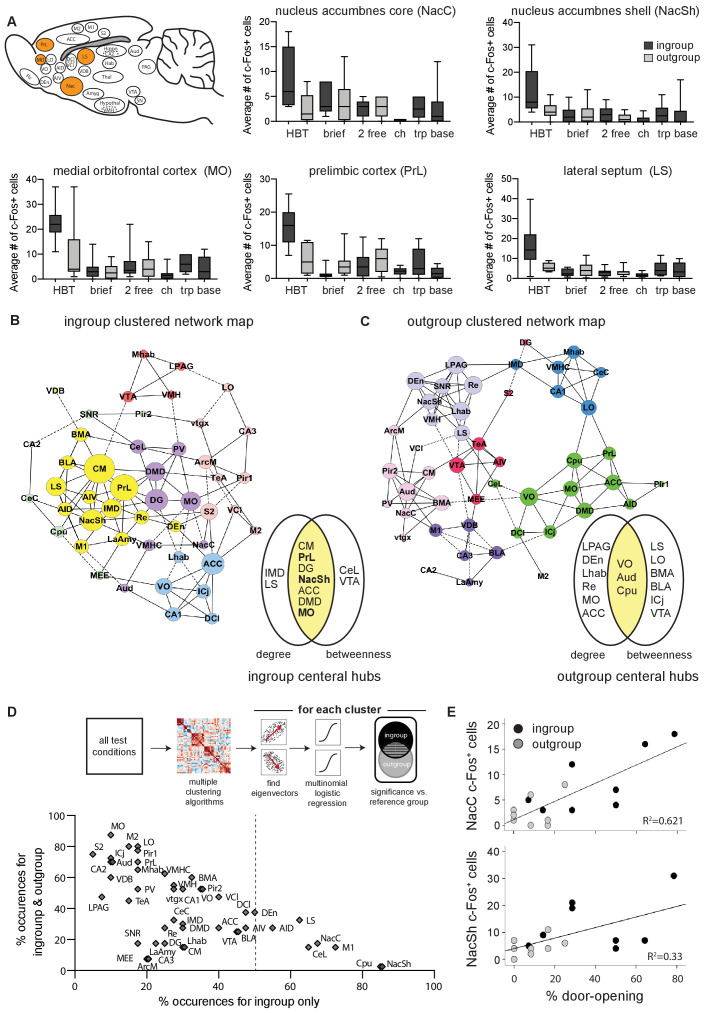
Figure 3. The nucleus accumbens (Nac) is selectively active for the helping behavior test (HBT) ingroup condition.
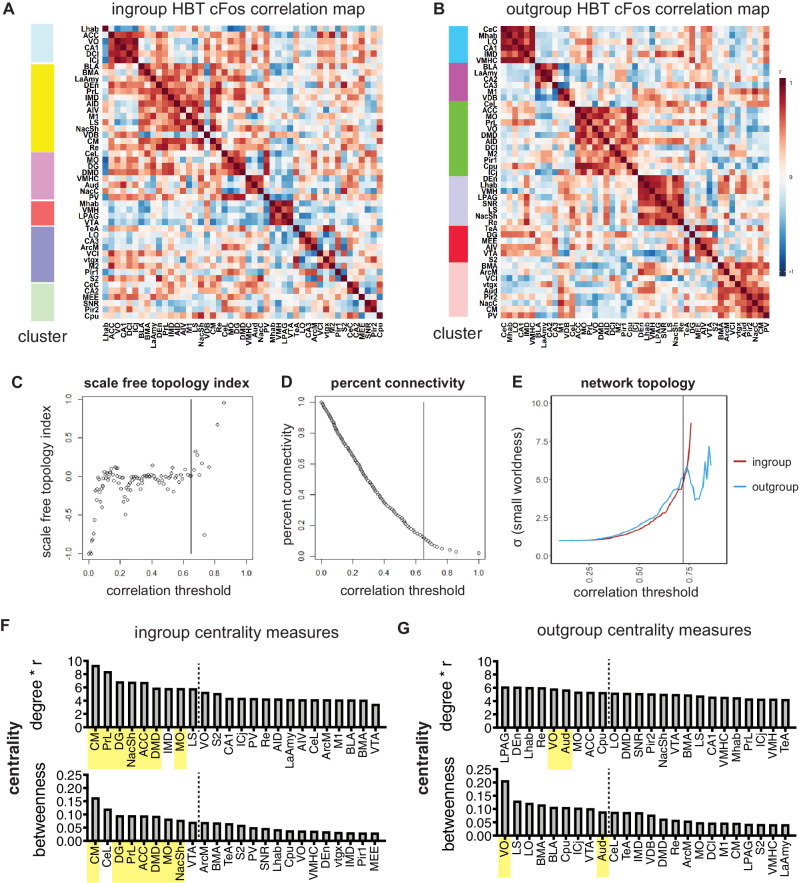
The Nac was activated selectively for trapped ingroup members. (A) Several brain regions (in orange) were significantly more active in the HBT ingroup compared to the HBT outgroup condition (p<0.05). c-Fos numbers are also shown for the brief, 2 free, chocolate (ch), trapped (trp), and baseline (base) conditions. (B, C) Network graph depicting the top 10% inter-region correlations for the HBT ingroup and outgroup conditions. Positive correlations are shown in solid lines, negative correlations in dashed lines. Central hubs were determined as the top 20% of regions with highest in both degree and betweenness (yellow). In bold, regions that were more active in the HBT ingroup condition than the outgroup. Circle color represents clusters identified via a Louvain algorithm, circle size represents the number of degrees for each region. (D) A series of multiple logistical regression tests on all test conditions identified clusters of brain regions that aligned with the distinct brain activity in the helping test conditions. The figure contrasts regions uniquely observed for the ingroup condition (x-axis) with regions observed for both ingroup and outgroup conditions (y-axis). The nucleus accumbens shell (NacSh) and nucleus accumbens core (NacC) were present uniquely in the ingroup condition in 85 and 67.5% of tests, respectively. Dashed line represents the boundary for the regions that are required to identify the ingroup condition based on brain activity. Diagram describes how the graph was derived. (E) Activity in the NacC and NacSh was positively correlated with door-opening behavior. No other regions were significantly correlated with helping.


