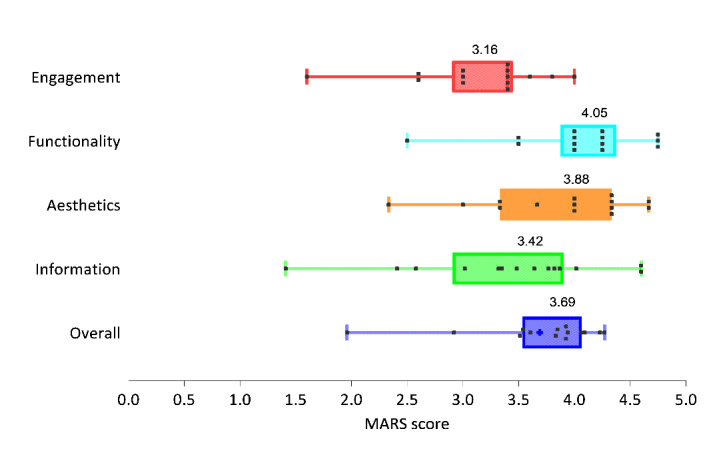
Figure 3.

MARS scores by section. The box plot shows the mean, IQR, minimum, and maximum scores. The left and right edge of the boxes represent the first and third quartiles, the line within the boxes represents the mean, and the left and right whiskers represents the minimum and maximum scores. The scatter plot shows the distribution of MARS scores evaluated by 2 raters. MARS: Mobile App Rating Scale.
