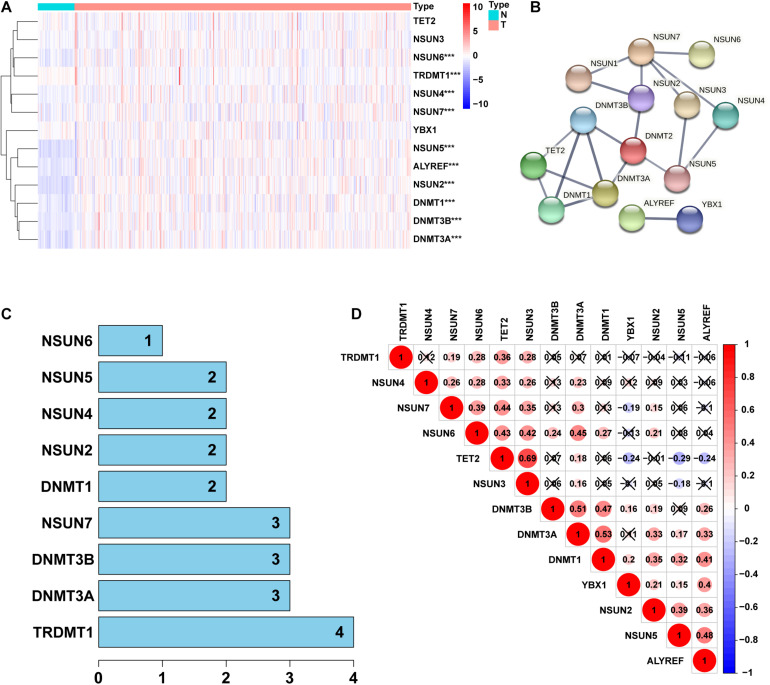
FIGURE 1.
Identification of differentially expressed genes between 5-Methylcytosine (m5C) regulators in lung adenocarcinoma (LUAD) and normal groups. (A) Heatmap visually showing the differences in the expression of m5C regulators between the 2 groups. (B,C) Protein–protein interaction (PPI) network showing the interaction between differentially expressed genes among m5C regulators. (D) Pearson correlation analysis of the m5C regulators. N, normal samples; T, tumor samples; ***p < 0.001.

