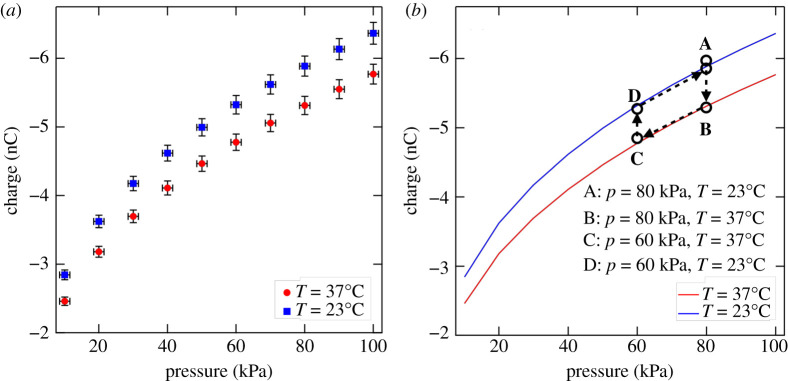
Figure 10.
(a) Charge (nC) plotted against pressure (kPa) for a polyester sample at temperatures of (red solid circles) and (blue solid squares) establishes the dependence of net charge on the thermodynamic variables.(b) Evolving the system through states A–D completes a closed thermodynamic cycle through adsorption and desorption when either the pressure or temperature is varied while keeping the other fixed. Red () and blue () curves are experimental data plotted in (a). (Online version in colour.)

