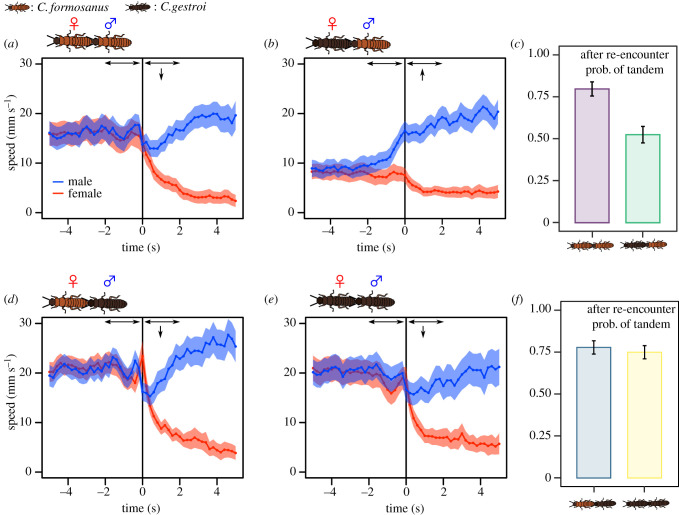
Figure 3.
Behavioural change of tandem runners before and after separation events. (a,b,d,e) The time development of speed across different combinations of mating pairs. Pair separation occurs at 0 s. Shaded regions indicate mean speed ± 2 s.e. Arrows indicate significant increase (upwards) or decrease (downwards) of male speed compared with before separation. (c,f) The probability of resumption of a tandem run upon re-encounter following a separation event. We obtained this probability by observing if a separated female and a male started a tandem run (=1) or not (=0) when they first came close enough for interaction after the separation event. Bars indicate the mean ± s.e. (Online version in colour.)

