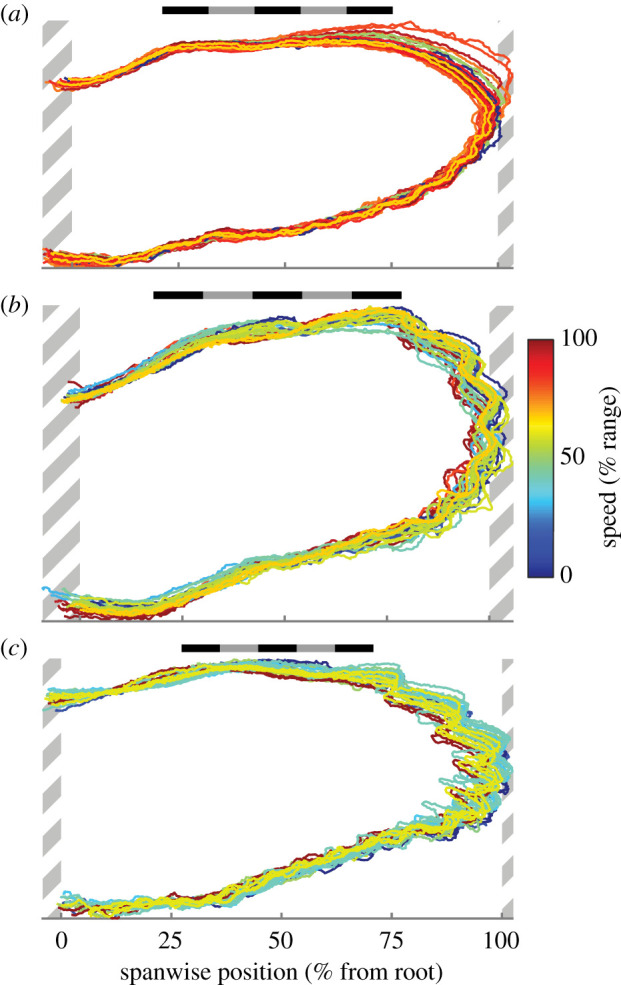
Figure 10.

Planform similarity across speeds. The outlines of left and right wings after alignment to a common reference wing. Wing outlines are coloured according to flight speed as a percentage of the observed range. (a) T. alba (n = 30 wings); (b) S. aluco (n = 28 wings); (c) A. gentilis (n = 26 wings). Hatched areas are regions of wing not included in analysis and contain fewer than one-third of the wings. Scale bars are 20 cm long.
