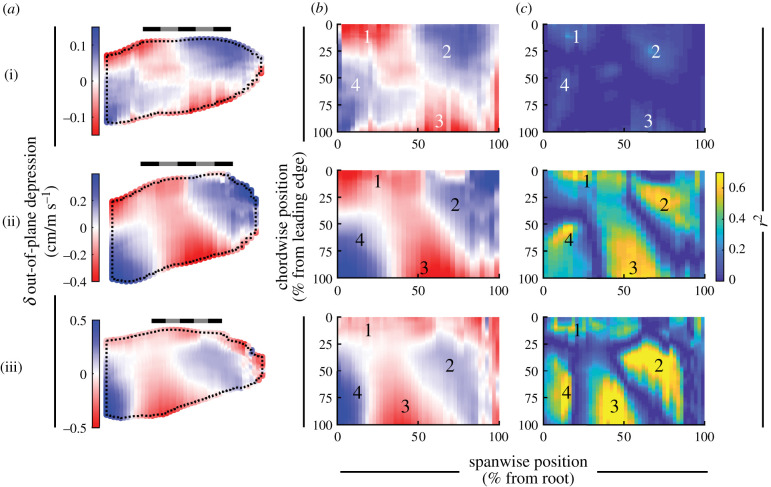
Figure 14.
Wings deformed in a saddle pattern with speed. (a,b) The out-of-plane depression (rise: negative) of the wing mapped to an average wing planform (a) or rectangle (b). (c) The distribution of the coefficient of determination (r2) for the relationship between the out-of-plane movement and speed across the wing, mapped to a rectangle. (i) T. alba; (ii) S. aluco; (iii) A. gentilis. (a) Scale bars are 20 cm long. (b,c) Labels ‘1'–‘4' indicate regions of deformation consistent across all three birds. Colour map flipped to retain depressive movements as blue, consistent with figure 13.

