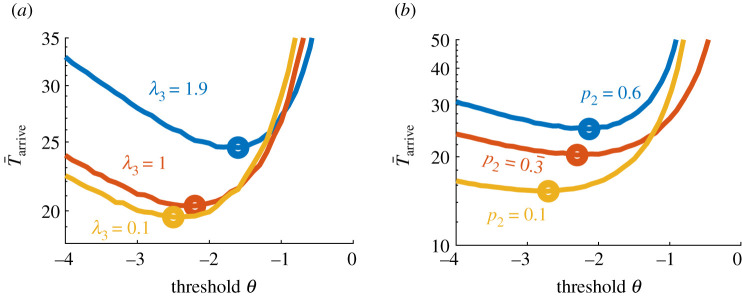
Figure 4.
Insensitivity of patch-finding performance to worst patch statistics. (a) increases with λ3, as does θopt, since the worst patches become less easy to distinguish from the best (λ1 = 3). Here λ2 = 2, τ = 5, p1 = p2 = p3 = 1/3. (b) increases with p2 (while p1 = 0.333 and p3 = 1 − p1 − p2), as does θopt. All curves for computed from 106 Monte Carlo simulations.

