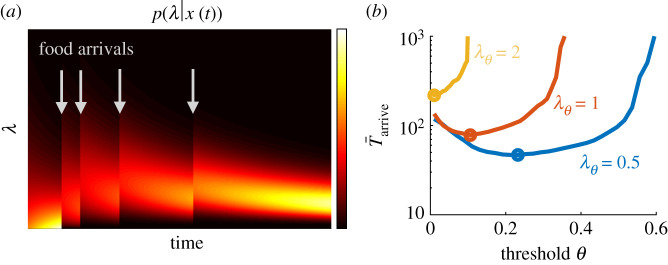
Figure 5.
Habitat selection given a continuum of patch types. (a) The posterior p(λ|x(t)) of the estimated yield rate is shifted up by each resource encounter and decreases between resource encounters. (b) There is an optimal θ that minimizes the time to arrive and remain in a high-yielding patch (λ > λθ), and the optimal time (circles) increases as the acceptable yield rate is increased. α = 1 is used here. 106 Monte Carlo simulations for each λθ and θ.

