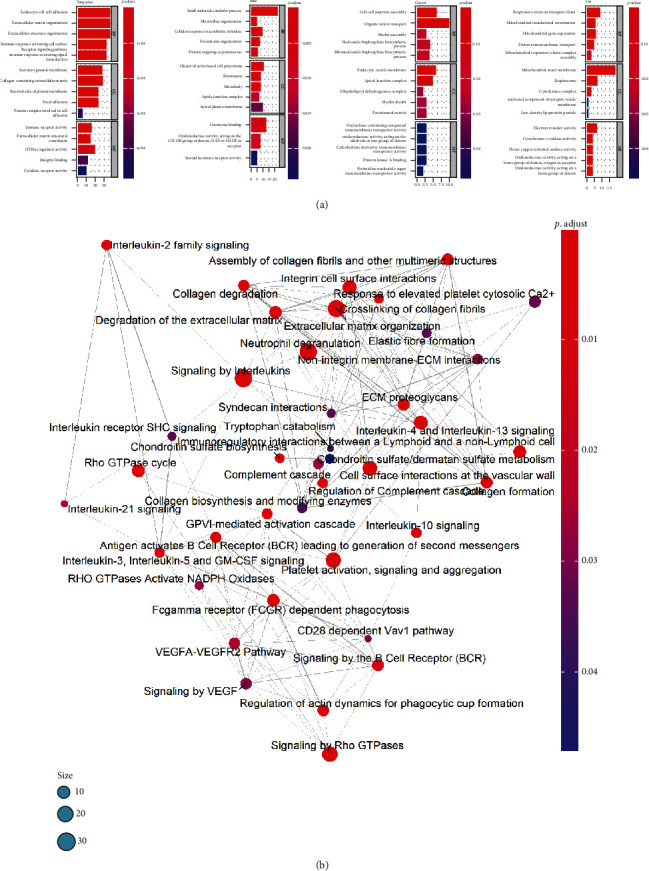
Figure 3.

GO enrichment and Reactome pathway analysis for dysregulated gene modules. (a) Bar charts showing the top 5 GO terms for biological process (BP), cellular component (CC), and molecular function (MF) in four modules (P < 0.05). (b) Pathway crosstalk among gene-enriched pathways of the turquoise module. Nodes represent pathways, and edges represent crosstalk between pathways.
