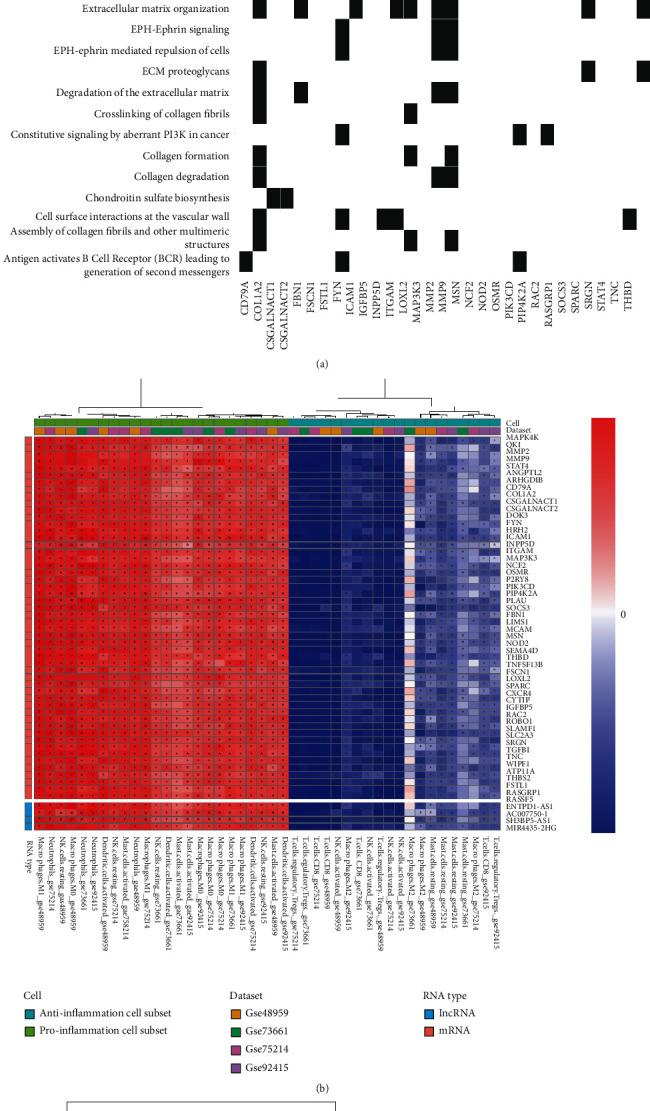
Figure 6.

Correlation between the gene of the ceRNA network and inflammatory pathway. (a) Heat map represents an association matrix of mRNAs in the ceRNA network and Reactome pathway terms. (b) Correlation analysis between the abundance of tissue-infiltrating immune cells and the expression of lncRNAs/mRNAs in respective datasets. Asterisks denote significant correlations after P value corrections (P < 0.05). (c) Correlation analysis between the abundance of tissue-infiltrating immune cells and the expression of miRNAs in respective datasets. Asterisks denote significant correlations after P value corrections (P < 0.05).
