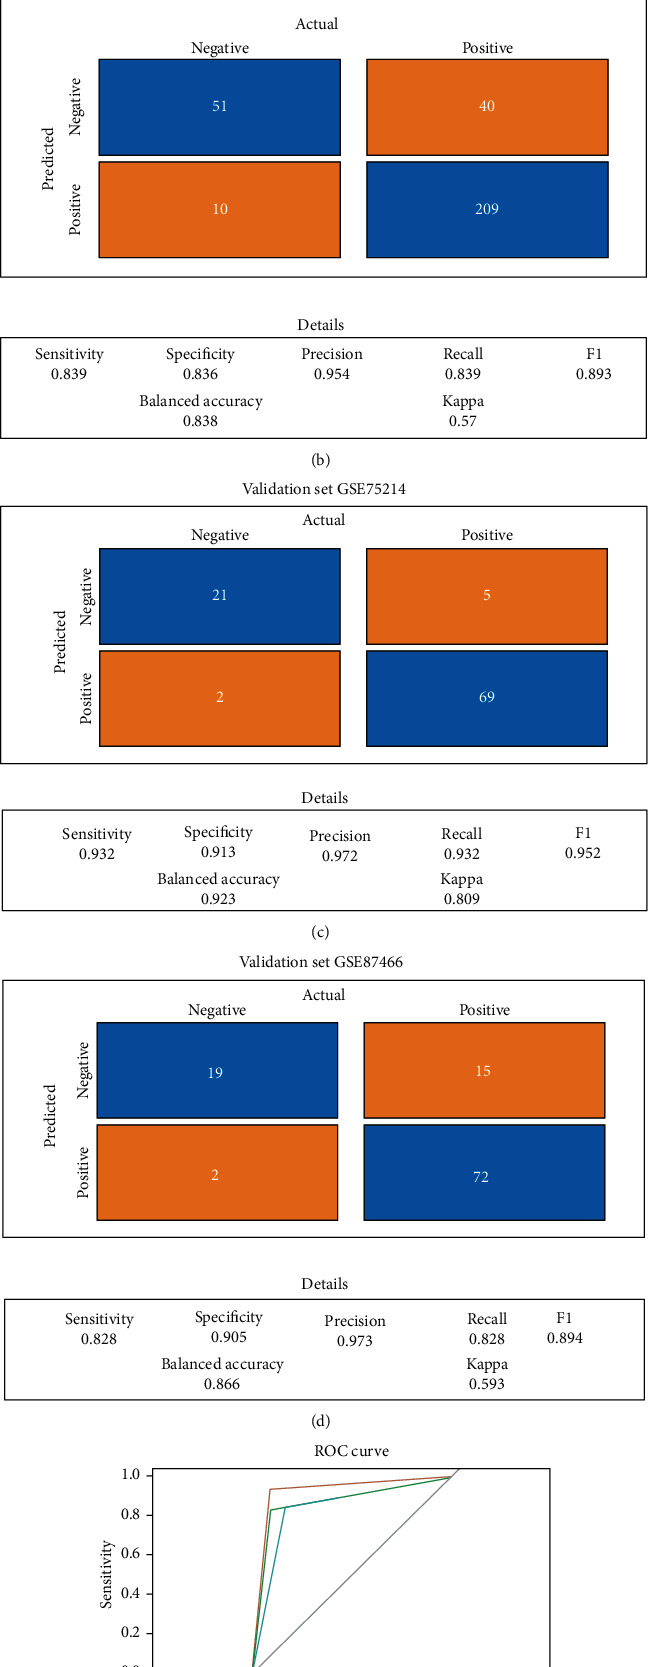
Figure 7.

Establishment of a severity detection for the UC patients using a decision tree. (a) Decision tree (the normalized MIR4435-2HG expression values are shown, and all gene expressions were standardized during the calculation). (b) Confusion matrix for the training dataset. (c) Confusion matrix for the validation set GSE75214. (d) Confusion matrix for the validation set GSE87466. (e) ROC curve of the model for the training set and two validation sets. The vertical axis represents sensitivity, and the horizontal axis represents specificity.
