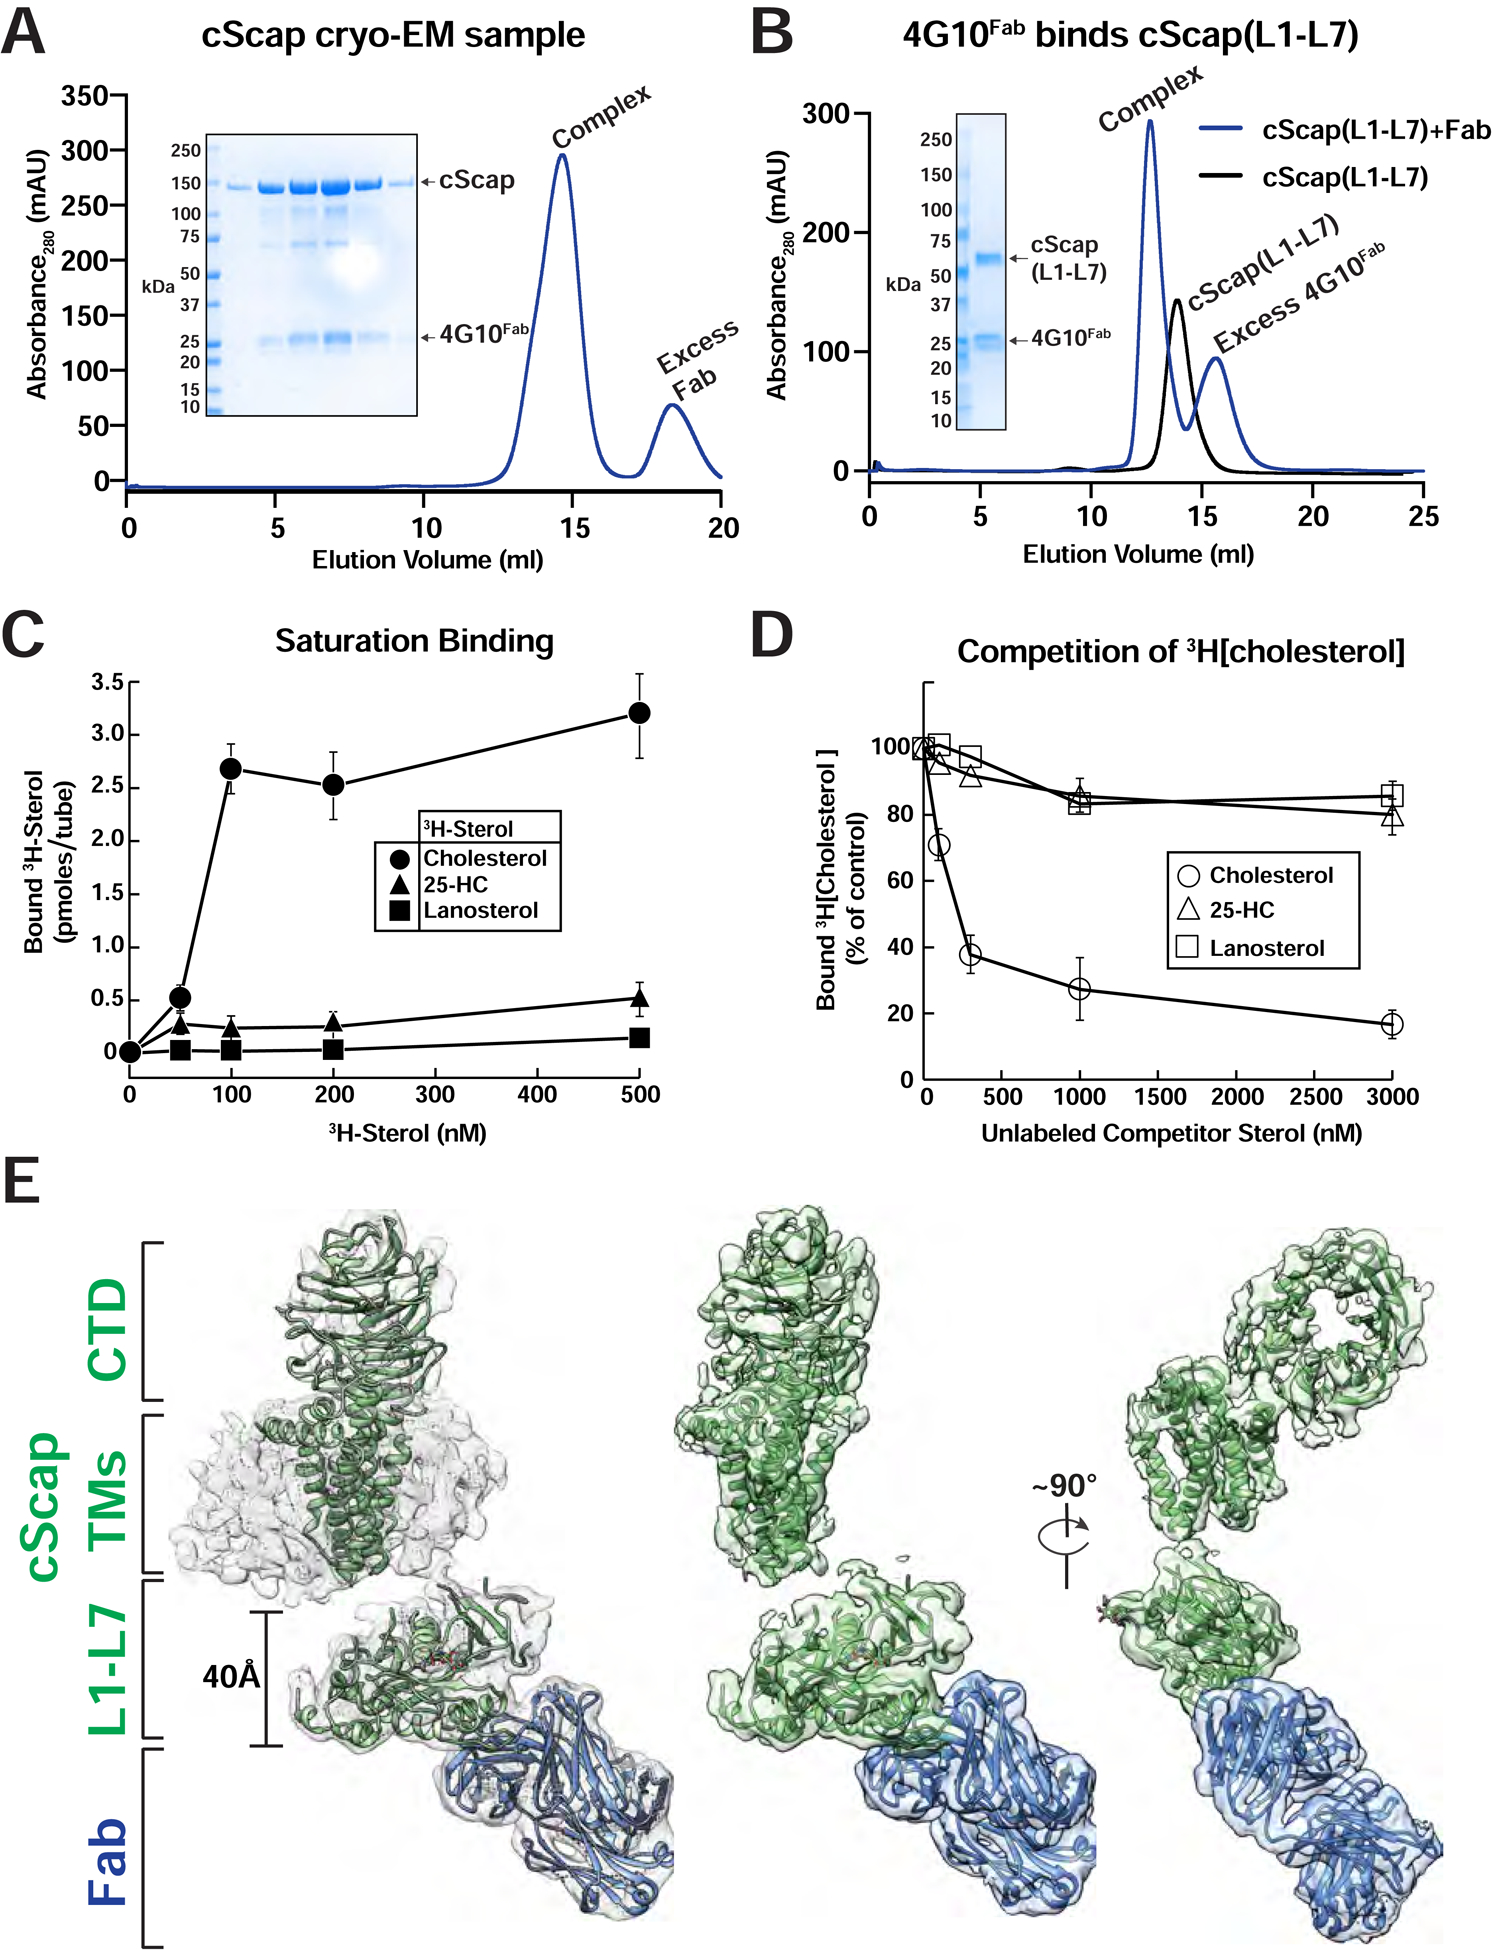
Figure 2. Purification, Sterol Binding, and Cryo-EM Structure of cScap.

(A) Purification traces for the cryo-EM grid preparation of cScap/4G10Fab complexes. 2 mg of cScap was incubated with 1.3 mg 4G10Fab for 3 hrs on ice. The Scap/4G10Fab complex was then purified by gel filtration (blue trace) as described in Methods. Inset: SDS-PAGE analysis for the Scap/4G10Fab complex used in the cryo-EM grid preparation. The peak eluted at 1 mg/ml in the central fractions. An aliquot of 10 μL of each fraction was subjected to SDS-PAGE on a 4–16% gradient gel. Coomassie staining reveals the presence of stoichiometric cScap and 4G10Fab.
(B) 4G10Fab binds the cScap(L1-L7) fusion. Secreted cScap(L1-L7) was purified as described in Methods. 860 μg aliquots were mixed with either buffer or with 1760 μg of 4G10Fab and subjected to gel filtration as described in Methods. The binding of 4G10Fab to the cScap(L1-L7) fusion protein results in a left-shift of the elution volume by 0.8 mL relative to cScap(L1-L7) alone. The unbound 4G10Fab elutes after cScap(L1-L7). Inset: SDS-PAGE analysis of the fractions from the complex trace. The wells, from left to right, were loaded with protein standards, input samples for cScap(L1-L7), 4G10Fab, protein standards, and aliquots from the chromatography elution fractions.
(C, D) Sterol binding properties of cScap. Each binding reaction contained 2 μg of His8-tagged cScap and varying concentrations of the indicated 3H-sterol (cholesterol, 106,000 dpm/pmol; 25-HC, 188,000 dpm/pmol; lanosterol, 22,000 dpm/pmol) (C) or 150 nM [3H]cholesterol and varying concentrations of the indicated unlabeled sterol (D). After incubation for 4 hr at 4°C, sterol binding was measured as described in Methods. The 100% of control value in (D), determined in the absence of competitor sterol, was 2.9 pmol/tube. Each data point denotes the average of three assays, and error bars represent ± SEM. When not visible, error bars are smaller than the size of the symbols.
(E) Cryo-EM structure of cScap. Left: cryo-EM density contoured at 0.013 with the model docked in. cScap is colored green and the 4G10Fab is colored blue. The models of the TM domain and CTD of cScap were built using SWISS-MODEL, and rigid-body fitted into the cryo-EM density. Center: Same view as Left, with micelle density masked out. Right: cScap rotated 90° relative to Center.
See also Figures S2, S3, and Table S1.
