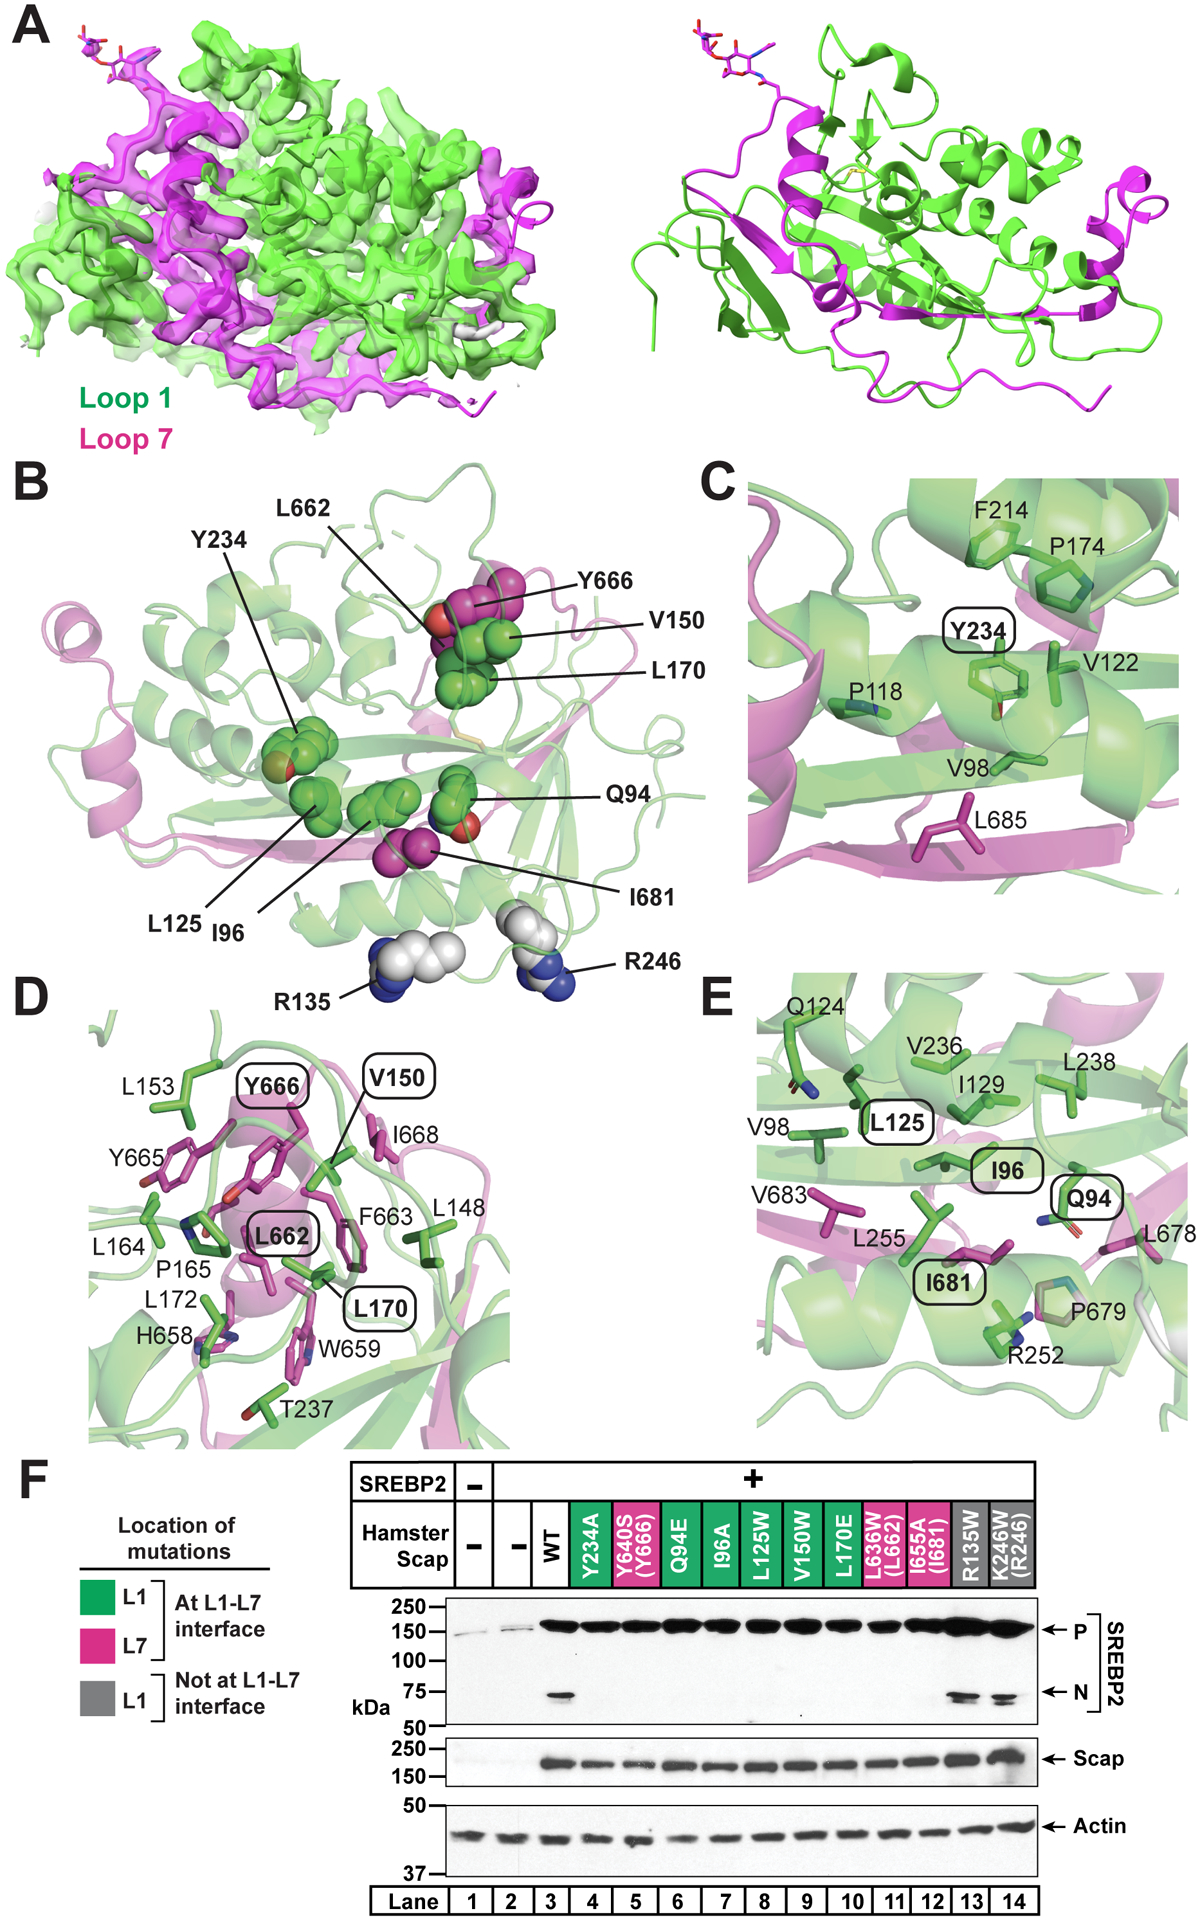
Figure 3. Structure of the L1-L7 Domain of cScap.

(A) cScap L1-L7 domain. Left: cryo-EM density and model for the cScap L1-L7 domain structure contoured at level 0.0537. The model and the density within 2.5 Å of the coordinates are colored green (L1) or magenta (L7). Image generated using USCF Chimera. Right: Atomic model shown without the cryo-EM density. L1 residues are colored green and L7 residues are colored as magenta. Image generated using Chimera.
(B) Location of key residues in the L1-L7 domain. Domain is rotated 180° towards the reader from the view in A. Side chains of residues interrogated by mutagenesis are depicted as spheres. Green spheres are L1 residues predicted to disrupt the interaction of L1 with L7. Magenta spheres are L7 residues predicted to disrupt the interaction of L7 with L1. Grey spheres are L1 residues in the Fab-binding interface that are solvent-accessible and away from the L1-L7 interface.
(C) Environment of Y234, which is labeled with oval. Side chains within 4 Å of Y234 are shown as sticks and the residue numbers indicated.
(D) Environment of V150, L170, L662, and Y666. These residues are labeled with ovals. Side chains within 4 Å are shown as sticks and the residue numbers indicated.
(E) Environment of Q94, I96, L125, and I681. These residues are labeled with ovals. Side chains within 4 Å of these residues’ side chains are shown as sticks and the residue numbers indicated.
(F) Effect of L1 and L7 mutations on Scap function. Mutations to L1 predicted to disrupt the interaction of L1 with L7 are labeled green. Mutations to L7 predicted to disrupt the interaction of L7 with L1 are labeled magenta. Mutations on the surface of L1 (remote from L7) are labeled grey. Parentheses indicate the analogous residues in cScap when different from hamster Scap. Scap-null hamster SRD-13A cells were set up and transfected as described in Methods with 4 μg pcDNA control plasmid (lane 1), 2 μg pTK-SREBP2 (lane 2), or else 2 μg pTK-SREBP2 and 2 μg WT or mutant pTK-Scap as indicated. The total amount of transfected DNA for all conditions was adjusted to 4 μg with pcDNA control plasmid. The next day, cells were depleted of cholesterol for 1 hr, harvested, and subjected to SDS-PAGE followed by immunoblot analysis of SREBP2 (IgG-22D5), Scap (IgG-4H4), and actin (anti-actin) as described in Methods. P, precursor form of SREBP2; N, cleaved nuclear form of SREBP2.
See also Figures S4, S5, and Table S1.
