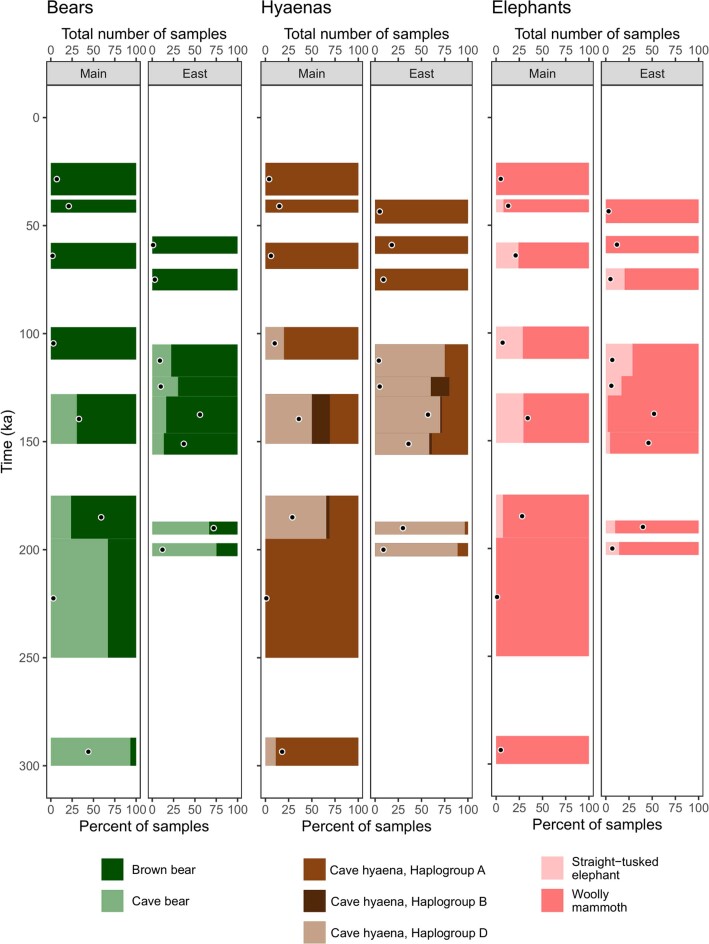
Extended Data Fig. 10. Numbers and proportions of ancient mtDNA fragments assigned to different mtDNA groups of ursids, hyaenids and elephantids in Main and East Chambers.
Black-and-white circles denote the total number of samples assigned to a specific mtDNA clade, plotted as a function of time (mean age for the relevant layer). The corresponding bars are colour-coded on the basis of the proportion (in per cent) of samples assigned to each group, and extend over the time intervals for the respective layers in Main and East Chambers.

