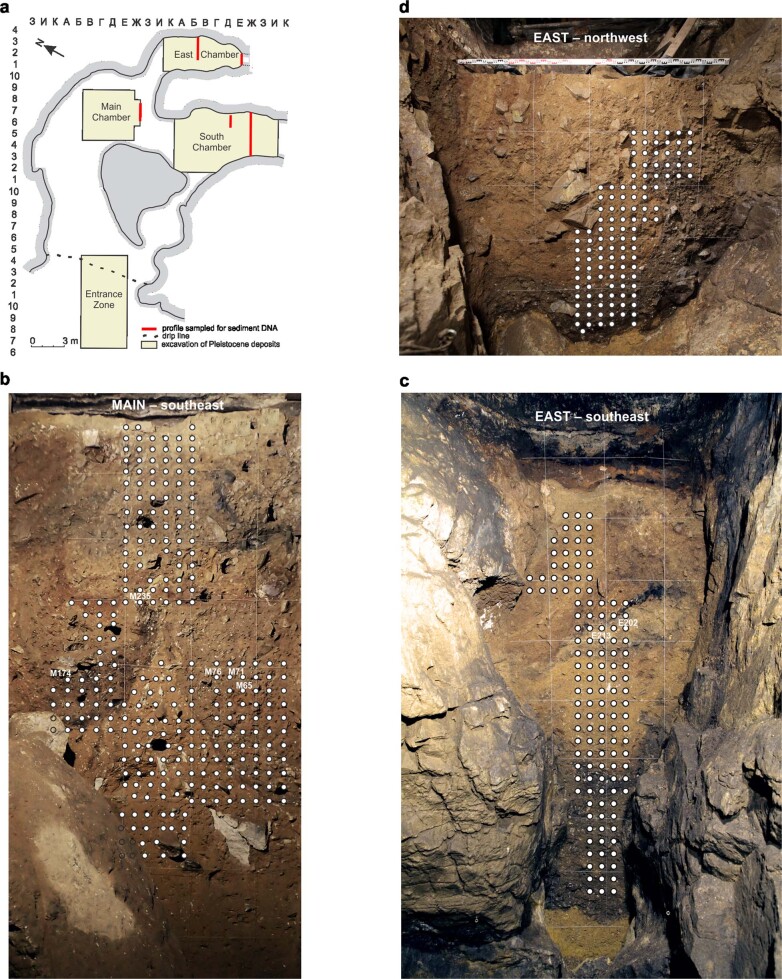
Extended Data Fig. 2. Locations of sediment DNA samples.
a, Plan of cave interior, showing location of each chamber. Red lines denote stratigraphic profiles sampled in 2017. Grid coordinates for the excavation squares are shown along the top and left side of the plan, and the corresponding squares (each consisting of a Cyrillic letter and a number) are shown at the top of the stratigraphic profiles in Fig. 1a–c, Extended Data Figs. 3a, b, 5, 8, 9, Supplementary Figs. 1, 2, 3b, d. b, Southeast profile of Main Chamber after excavations in 2016. c, Southeast profile of East Chamber after excavation in 2015. d, Northwest profile of East Chamber after excavation in 2016. White circles represent samples collected for sediment DNA analysis. Individual sample numbers are provided in Supplementary Figs. 1 (Main) and 2 (East); sample numbers referred to in the text are indicated in b, c. Sample locations in South Chamber are indicated in Extended Data Fig. 3a, b, Supplementary Fig. 3.

