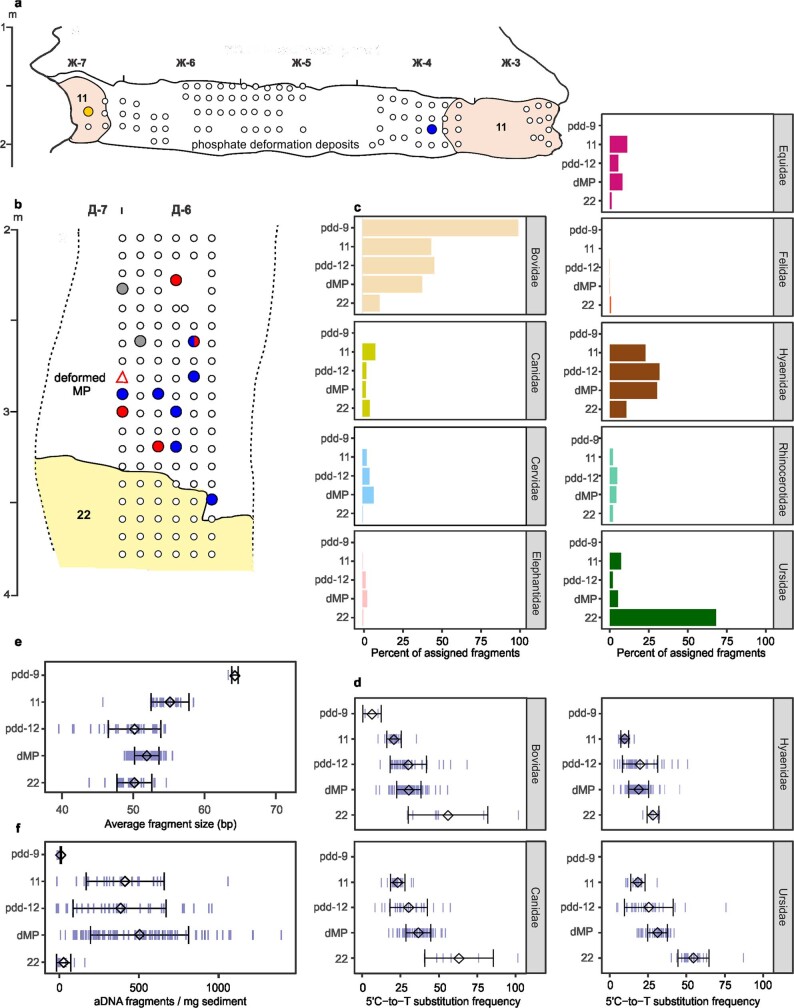
Extended Data Fig. 3. Ancient hominin and mammalian mtDNA data for sediment samples in South Chamber.
a, b, Sample locations in upper section (a) and lower section (b) of southeast profile, using the same symbols for hominins as in Fig. 1. Layer 11 (associated with the Initial Upper Palaeolithic) and layer 22 are numbered, but other layers are denoted as either deformed Middle Palaeolithic (dMP) or as phosphate deformation deposits (pdd-9 and -12). The dMP and pdd deposits have been substantially affected by post-depositional deformation and phosphatization, respectively (Supplementary Information section 2). c, Proportion of mtDNA fragments assigned to different families of large mammal in each layer, arranged in relative stratigraphic order. Values were obtained by averaging across the percentages of fragments assigned to each family in all samples from a specified layer. d, The 5′ C-to-T substitution frequencies (putative deamination rates, in per cent) of mtDNA fragments assigned to bovid, canid, hyaenid and ursid in each layer. Individual values are shown as vertical bars, and the mean and s.d. values by black symbols. e, Average size (base pairs (bp)) of mammalian mtDNA fragments in each layer; individual values are shown as vertical bars and the mean and s.d. values by black symbols. f, Number of unique mtDNA fragments in each layer assigned to mammalian taxa per milligram of sediment from each library; individual values are shown as vertical bars and the mean and s.d. values by black symbols. Spearman’s correlation test (one-sided) was used to test for correlation between stratigraphic depth (layer) and 5′ C-to-T substitution frequency (minimum n = 112, positive correlation, maximum P = 1.8 × 10⁻⁵), number of unique ancient mtDNA fragments (minimum n = 79, negative correlation, maximum P = 1.7 × 10⁻⁵), and average fragment size (minimum n = 79, negative correlation, maximum P = 1.8 × 10⁻⁸).

