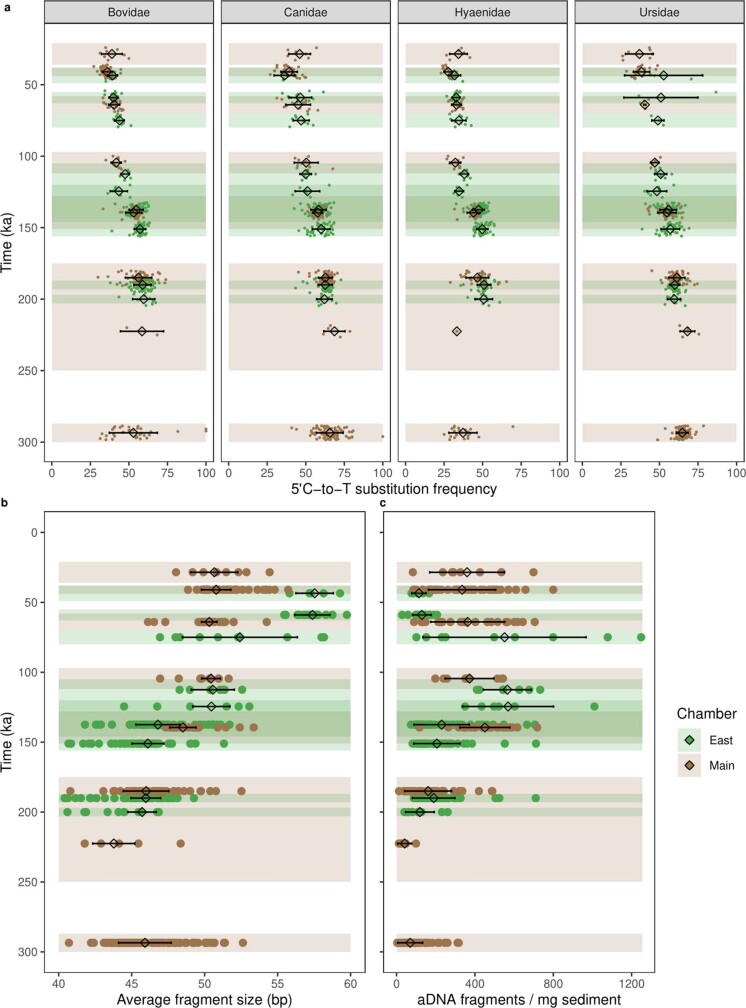
Extended Data Fig. 4. Ancient mammalian mtDNA preservation in Main and East Chambers.
a, The 5′ C-to-T substitution frequencies (putative deamination rates, in per cent) of mtDNA fragments assigned to bovid, canid, hyaenid and ursid, plotted as a function of time. b, c, Average size of mammalian mtDNA fragments (b) and number of unique mtDNA fragments assigned to taxa per milligram of sediment from each library (c), plotted as a function of time. Individual values for Main and East Chambers are shown as brown and green circles, respectively, and the mean and s.d. values by black symbols. The latter symbols are positioned on the time axis at the mean age for the relevant layer, and the time intervals for the corresponding layers in Main and East Chambers are denoted by brown and green shading, respectively (Extended Data Fig. 1). Spearman’s correlation test (one-sided) was used to test for correlation between stratigraphic depth (layer) and 5′ C-to-T substitution frequency (minimum n = 133, positive correlation, maximum P = 2.7 × 10⁻⁸), number of unique ancient mtDNA fragments (minimum n = 222, negative correlation, maximum P = 0.02), and average fragment size (minimum n = 222, negative correlation, maximum P = 2.0 × 10⁻²⁵).

