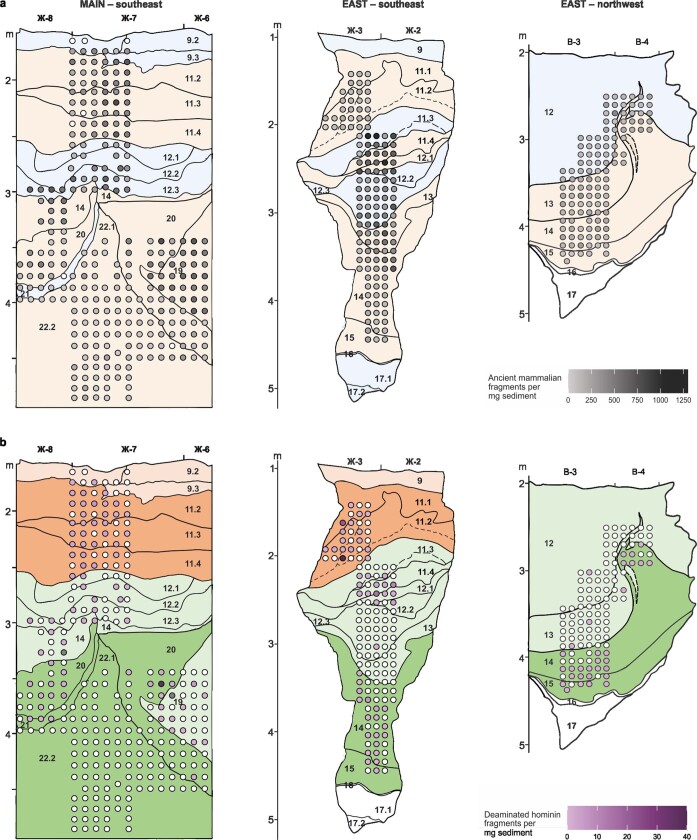
Extended Data Fig. 5. Abundance of ancient mammalian and hominin mtDNA in Main and East Chambers.
a, b, Number of unique mtDNA fragments assigned to mammalian taxa (a) and number of deaminated fragments assigned to hominins (b) per milligram of sediment from each library, for samples in Main Chamber (southeast profile) and East Chamber (southeast and northwest profiles). Ancient mammalian fragments encompass all mtDNA fragments assigned to families deemed to contain ancient DNA on the basis of signals of cytosine deamination. Intensity of shading in filled circles reflects relative abundance; samples that yielded no ancient mtDNA are shown as white circles. Background shading in a denotes layers that were deposited under relatively cold (blue) or relatively warm (orange) conditions8, and in b denotes layers associated with early Middle Palaeolithic (dark green), middle Middle Palaeolithic (light green), Initial Upper Palaeolithic (dark orange) and Upper Palaeolithic (light orange) archaeological assemblages8.

